Can’t believe that we’re already at the tail end of 2022!
What a crazy year it has been! The rapidly changing global environment on financial, social, political, technological, climate, and many other fronts has kept everyone on their toes. A lot has been spoken about it online and offline, so no, we won’t start a new thread. Instead, let’s focus on what’s been cooking at Tinace for the past few months.
We’ve been hard at work!
- $16 million in Series B funding: In October 2022, we announced a funding infusion. This comes at a critical juncture when investors are pulling money out of markets, firms are freezing budgets, and high-growth startups are struggling to justify valuations. We’d like to thank our investors for providing the fuel to continue our growth and believing in our vision.
- 2022 Gartner® Magic Quadrant™ for Analytics and BI Platforms: A few months into the year, Tinace made its inaugural entry into the prestigious Magic Quadrant. Not only is that unheard of for a company at our stage — where we fight it out with the archaic giants — but we also made it to the Visionary quadrant instead of landing as a Niche Player.
- 2022 Gartner® Market Guide for Multipersona Data Science and Machine Learning (DSML) platforms: In the summer of 2022, Tinace was added to the Market Guide as a Representative Vendor – the only vendor to be listed on both the Magic Quadrant for Analytics/BI and DSML Market Guide.
- Product launches: In 2022, we launched 3.8, 3.9, and today, we’re stoked to announce the launch of Tinace 4.0!
This is a testament to the product built, and the infallible support received from our customers. Let’s dive deeper into our motivation to build 4.0, the use cases around it, and where to find more details. Read on!
In This Post
How to tackle dashboard chaos
Over time, organizations end up with hundreds of dashboards to arrive at informed decisions. Adding every dashboard impedes users from deriving holistic vantages (think: toggling, context switching, mental stitchwork etc.). Here’s an example:
You’re a marketing manager seeking to improve the efficacy of your website. To make better decisions, you want to look at leads and opportunities from your CRM alongside website traffic data from Google Analytics. But these data sources are vastly different — i.e., they lack a common join — so you’re stuck with multiple tabs in your browser, eyeballing different metrics and making your best guess about what’s happening. Also, you might dump a lot of data from different places into a spreadsheet and do the manual grind.
Here’s another:
You’re a data analyst trying to analyze operating expenses across sales, marketing, and IT. You’re stitching together data across multiple business units that frequently don’t mesh due to a lack of commonality. Even if you succeed in seeing patterns, you end up asking “why”, i.e., “Why is OPEX trending up?”
Like the marketer, you’re toggling between various dashboards and reports to get holistic visibility.
What are Multi-Business View Vizpads?
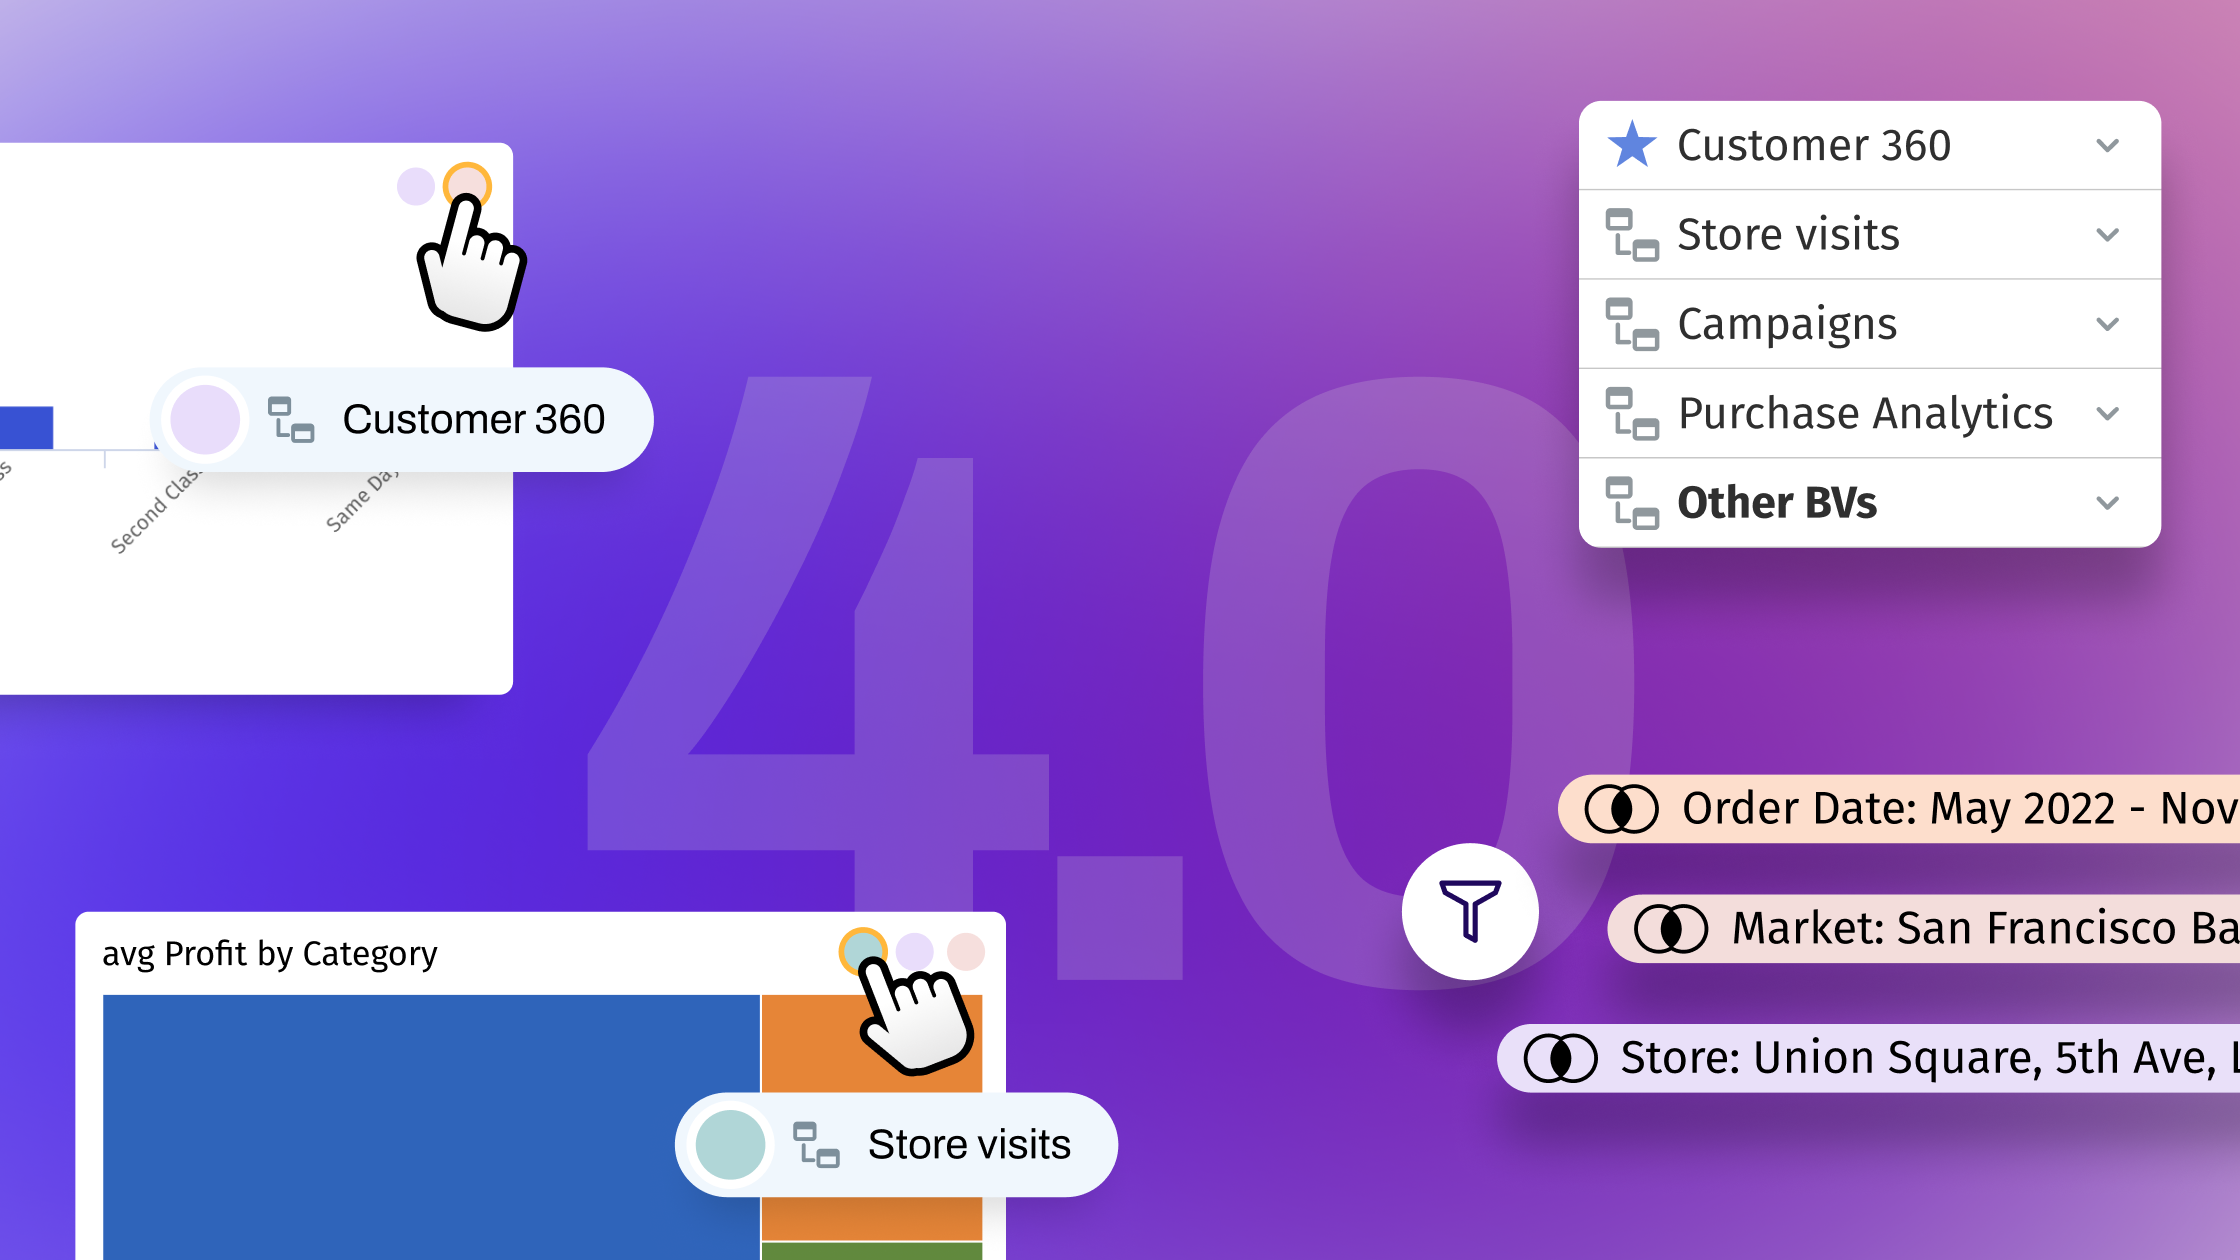
In 4.0, Tinace tackles the disconnected data problems by introducing Multi-Business View (MBV) Vizpads. MBV Vizpads are a powerful way to unify, analyze, and interact with disparate datasets on one actionable canvas regardless of prerequisite joins. With MBV Vizpads, you can:
- Easily visualize charts from various Business Views (i.e., datasets and data models)
- Interact with data across different data models without joining them
- Share unified dashboards with stakeholders
How are customers leveraging MBV Vizpads?
MBV Vizpad is a highly versatile (and top-requested) feature. Here are three ways in which our beta customers from various industries leverage MBV Vizpads:
- Unifying disparate analytics objects: Instead of jumping amongst various dashboards, reports, and applications, customers are using MBV Vizpads for side-by-side analyses and investigations (such as viewing, filtering, and drilling) across data models for a more holistic view of the business. For example, consider a sales team comparing profitable customers from their CRM against the leads captured in HubSpot to quickly identify valuable look-alikes. At the same time, imagine a supply chain team viewing various products at a store/shopper, on a weekly/monthly basis, and package level — all in one place.
- Elevating the executive view of a business: Some customers are leveling up their previously static executive reporting and dashboards with live views and powerful insights for a 360o view of their business. For example, users can now view the metrics and drivers (!) of OPEX across Sales, Marketing, IT, and G&A.
- Centralizing the decision-making portal: MBV Vizpads can also be used to organize the analysis in one portal for faster, more robust decision-making. For example, marketing teams can look at the omnichannel mix and customer journey in one place and spot opportunities.
MBV Vizpads significantly reduce the friction of getting a holistic vantage, thereby unlocking analysis that might not have been possible before due to the manually tedious and error-prone methods.
4.0 Highlights
With the 4.0 release, we continue to invest in the entire user journey on our platform, with a core focus on user onboarding, ad-hoc analysis, and enterprise-grade capabilities. Here’s a quick summary of the top features:
Accelerated onboarding and time to insights 📈
- Contextual and guided walkthroughs help you ramp up on the platform quickly, thus reducing time to onboard and realize value from the data quickly.
- We’ve reintroduced the in-app chat support to start real-time conversations with our team where you can easily ask, learn, and discover insights.
- A new feedback interface allows users to suggest features, report issues, and create support tickets on the fly, so the platform grows with your needs.
Supercharged ad-hoc analysis 🚀

- Predefined time periods, custom date ranges, and intelligent time slices builder elevate the user experience to perform time-based analysis intuitively.
- Search keyword disambiguation helps you to customize the search results as required and get the intended insights.
- With the addition of date operators such as Since and From, we continue to make Search easier and ask questions in natural language.
Robust enterprise-grade upgrades 🧑💻
- Default user groups solve the blank slate problem by automatically sharing the content with the newly added users.
- Native Spark SQL connector is another step to make the platform compatible with our expanding enterprise reach.
- Support for OAuth-based authentication and service-based accounts let users seamlessly gain authorized access to Snowflake datasets.
We’ve made a fundamental shift by simplifying the way users interact with Tinace. With these improvements, Tinace continues to make data analysis more accessible and agile. It’s now simpler to visualize answers to your questions and make better data-driven decisions.
Join us for a deep dive session on November 16, 2022, to catch the story behind each feature released in 4.0.
A big shout-out to all the product teams (Product Management, Design, Engineering, and Product Marketing) at Tinace for shipping a release full of critical features and customer requests. Check out our release notes for the comprehensive list of features.
We always strive to help you discover valuable insights with our future releases. Never hesitate to send your thoughts, comments, and suggestions to info@tinace.asia; we’d love to hear from you!