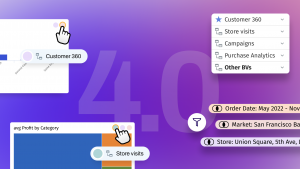
Highlighting the top features introduced
Our product teams have been hard at work to innovate on behalf of our customers. Despite the ups and downs of the macro-economic situation, our team has been focused on delivering the best possible product experiences for our customers. I’d like to thank everyone for their hard work and sincere efforts during these uncertain times.
Over the past few months, we’ve released major groundbreaking features that’ll completely change the way users analyze their cloud data.
We’re excited to share highlights on some of the top features released. Here’s a sneak peak into some of the features (in case you weren’t able to attend the webinar yesterday).
Let’s dive deeper!
Live Insights
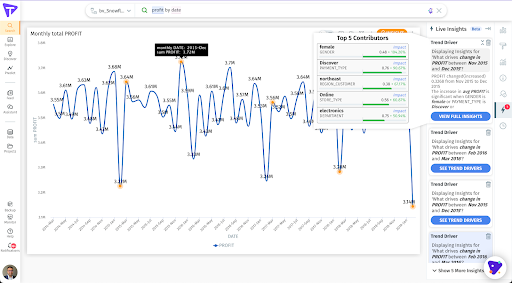
Live Insights automatically analyze millions of data combinations at blazing speed without extracting/moving the data from its source.
Users can leverage live Insights to help identify trend drivers, compare cohorts, and spot anomalies in the data stored on cloud data warehouses such as Snowflake and Databricks DeltaLake.
Users can kick-off of Live Insights directly from Search or Vizpad. Once available, the insights can be viewed as a slideout card on the right nav panel. Quick insights such as top drivers and contributors can be viewed at a glance without going to the expanded insights experience.
Note:
- Live Insights are currently available for Trend Insights and Cohort Insights.
- Live Insights are only available for datasets/datasources with a live connection.
Year-over-Year Analysis
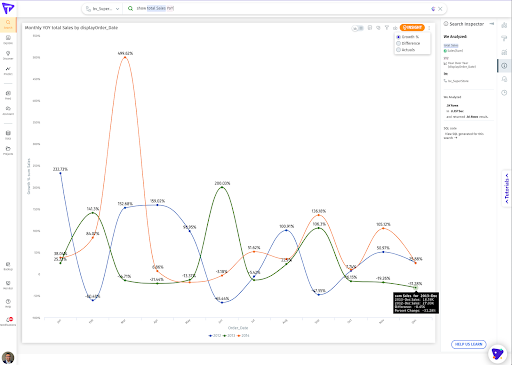
Year-over-Year (YoY) compares data from one time period with the data from a similar time period in the previous year. Users can analyze the results as either Growth Percentage, Difference in values, or Actual values between the current & previous time period.
This feature is particularly a big one as users don’t need to create custom columns or write complex formulas to compare data from similar time windows across different time periods.
Based on the demand/requests we’ve received, we anticipate that this will become one of the most used time-series analysis!
Note: Support for year-over-year has been added to Search as well as Vizpads.
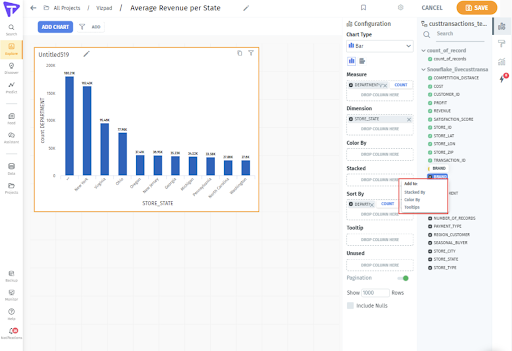
Marketshare Analysis
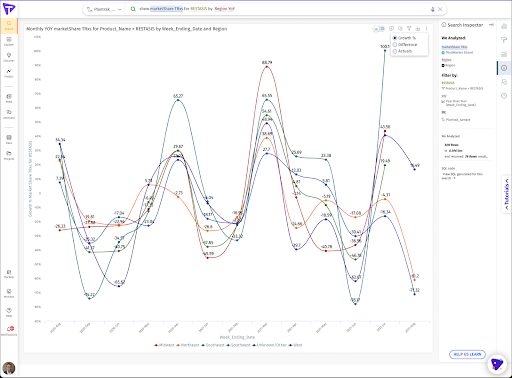
Market Share Analysis provides deeper insights into the contribution of a dimension group to another group in the same dimension or another. For example: Analyzing the portion of an industry’s sales / products / brands / SKUs that a particular company owns in the market as compared to competitors.
Tinace provides Market Share analysis out-of-the-box as a standard aggregation. Similar to the YoY feature, this saves users tremendous time as they don’t have to write complex formulas, SQL, or do any data prep work.
Again, this is one of the top requested feature from our CPG and Pharma customers. We anticipate additional requests in this area.
Note: We’ve added support for Market Share Absolute Change and Market Share Percent Change to further provide advanced analytics out-of-the-box for our users.
Feeds & Alerts
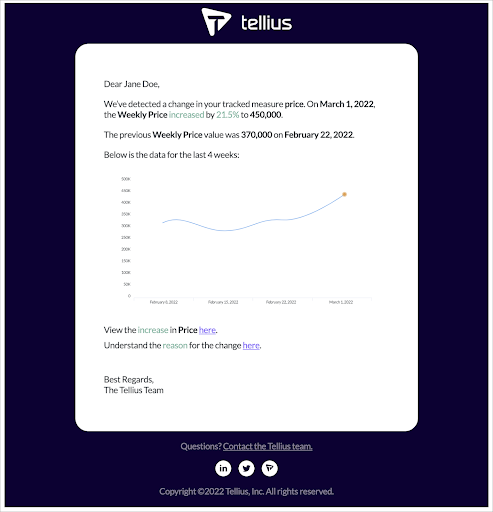
Feeds are generated whenever there’s a change in a metric of interest. Users are alerted of the changes (increase/decrease) and other details, along with links to the generated feed as well as the reason behind the change. This is sent to the users as an email along with links to the insight. There’s a way to reach out to Tinace to get any help/support on investigating this change further.
Google Big Query Connector
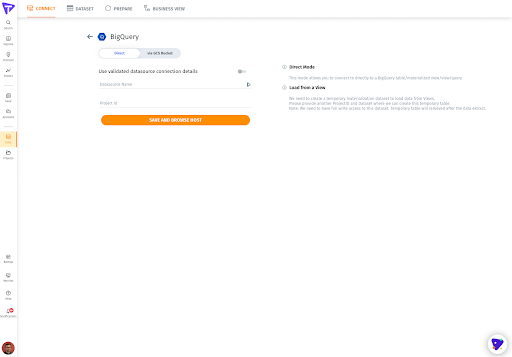
Users can now directly connect to a Google BigQuery database from Tinace. The new connector eliminates the previously needed intermediate step of connecting to the Google Cloud Storage (GCS) bucket.
Note: We will continue to support the Google BigQuery connection via the GCS bucket route until Tinace 4.2
Support of iPad and other tablet devices
Tinace has introduced native interactions for tablet devices. You can now work with devices such as iPad and other tablets through touch-enabled menu-based interactions for the Vizpads and Search modules.
Other Notable Features & Improvements
Customize Help
Administrators can customize the Help experience by providing links to custom assets such as internal documentation and videos. These custom links/assets replace Tinace provided help and videos that currently assist the users in understanding the product.
Filters in Help Tinace Learn
Starting in 3.9, the filter experience in Help Tinace Learn has been improved by adding support for new filter operators. On a dimension column, users can set =, !=, In, Not In, Contains filters, and on a measure column, <, <=, >, >=, = filters can be set.
Update Start day of the week
Chart results for date resolution queries are based on the time configuration set up for the environment. This date is used to mark the start of a week for time-based calculations.
Display Names in Search Guide & Exports
Search Guide now uses the display names instead of original column names wherever available. Data Export will contain display names as well.
Assign User Objects
Users can re-assign their content to a different user. Transfer of content ownership is critical in cases when a user is being removed from the system. Before transferring ownership and deleting a user, the preview pane lists out all the content owned by the user.
X/Y axis Target Lines
Users can add X and Y target lines for measure columns in the Scatter chart.
Condition Formatting Updates
Instead of using theme colors, users can specify the hex code (#ffffff) to update the background and text colors in any chart.
These were only a select few features that we worked on in the past few months. Check out our help documentation for a list of all features and to review the Release Notes on what we’ve been up to in the first half of 2022.
A big shot out to the product teams for delivering key customer asks along with rolling out strategic features.
As always, we look forward to your valuable feedback. Hoping to build simple yet powerful experiences for our customers during the remaining half of this year.
Stay safe and happy searching, analyzing and improving business outcomes!