What's New
Release 4.0
Release 3.9
Release 3.8
Release 3.7
Release 3.6
Release 3.5
Release 3.4
Release 3.3
Release 3.2
Release 3.1
Release 3.0
Release 2.4.1
Release 2.4
Free Cloud Trial
Release 2.3
Release 2.2
Release 2.1
Release 2.0
Release 1.8
Release 1.7
Release 1.6
Release 1.5
Tinace Home
Search (Natural Language)
Search in Tinace
Guide Me
How to Search
Business View List / Columns
Query
Search Result
Discover Insights
Interactions
Chart Operations
Add to Vizpad
Table View
Switch Chart type
Change Chart Config
Apply Filters
Change Formatting
Measure Aggregation - Market Share Change
View Raw Data
Download/ Export
Embed URL
Partial Data for Visualization
Best-fit visual
Add to Vizpad
Adding the chart to a Vizpad
Customize the auto-picked columns
Search Query Inspector
Teach Tinace
History
Guided Search
Add Guided Search Experience
Display Names in the Search Guide
Guided Search
Guided Search Syntax and Attributes
Deep Dive
Search Synonyms
Maps in Search
Search Keywords
Percentage Queries
Time Period Queries
Year-over-Year Analysis
Additional Filters
Pagination
List View In Search Results
Embed Search
Personalized Search
Search Cheat Sheet
Filters in Help Tinace Learn
Explore (Vizpads)
Dashboards in Tinace
Vizpad Creation
Create Interactive Content
Create Visualization Charts
List of Charts
Common Chart Types
Line Chart
Bar Chart
Pie Chart
Year-over-Year Functionality in Vizpad
Area Chart
Combo Chart
Treemaps
Bubble Chart
Histogram
Heat-Map Charts
Scatter Chart
Other Charts
Cohort Chart
For each chart
Create Visualization Charts
Global Filters
Embedded Filters
Other Content
Creating Interactive Content
Vizpad level Interactions
Viz level Interactions
Discover Insights
Drivers
Discover hidden insights - Genius Insights
How Genius Insights works
Discoveries in Insight
Anomalies on Trend
Interactions
Chart Operations
Embedding Vizpad
Vizpad Consumption
Collection of Interactive Content
Vizpad level Interactions
Global Filter on the fly
Global Resolutions
Refresh
Notifications / Alerts
Share
Download / Export
Unique name for Vizpads
Edit Column Width
Viz level Interactions
Multi-Business View Vizpads
Embedding Viz & Vizpads
Discover (Genius Insights)
Discoveries
What are discoveries
Type of Discoveries in Tinace
Create Discoveries
Kick-off Key Drivers
Edit Insights
Key Driver Insights
Components of Key Drivers
What are Key Drivers
Edit Key Driver Insights
Segment Drivers
Trend Drivers
Trend Insights (Why Insights)
Comparison Insights
Components of Comparison Insights
Create Comparison Insight
What are Comparison Insights
Edit Comparison Insights
Others Actions
Save
Refresh
Share Insights
Download
Adding Insights to Vizpad
Insights Enhancements
Embedding Insight
Impact Calculation for Top Contributors
Marketshare
Live Insights
Predict (Machine Learning)
Machine Learning
AutoML
How to create AutoML models
Leaderboard
Prediction
Others
What is AutoML
Point-n-Click Predict
Feed (Track Metrics)
Assistant (Conversations)
Tinace on Mobile devices
Data (Connect, Transform, Model)
Connectors
Connector Setup
Edit Connector
Live Connect
Data Import
Cache
Direct Business View
JDBC connector for PrestoDB
Google BigQuery Connector
Snowflake
List of Connectors by Type
Tables Connections
Custom SQL
Schedule Connector Refresh
Share Connections
Datasets
Load Datasets
Configure Datasets (Measure/Dimensions)
Transform Datasets
Create Business View
Share Datasets
Copy Datasets
Delete Datasets
Data Prep
Datasets
Data Profiling / Statistics
Transformations
Dataset Transform
Aggregate Transforms
Calculated Columns
SQL Transform
Python Transform
Create Hierarchies
Filter Data
SQL Code Snippets
Multiple Datasets Scripting SQL
Column Transforms
Column Metadata
Column type
Feature type
Aggregation
Data type
Special Types
Synonym
Rename Column
Filter Column
Delete Column
Variable Display Names
Other Functions
Dataset Information
Dataset Preview
Alter Pipeline Stage
Edit / Publish Datasets
Data Pipeline (Visual)
Alerts
Partitioning for JDBC Datasets
Export Dataset
Data Fusion
Schedule Refresh
Business Views
Create Business View
Create Business View
Datasets Preview & List
Add datasets to Model
Joins
Column selection
Column configuration
Primary Date
Geo-tagging state/country/city
Save to Fast Query Engine
Publish
Business View
What is Data Model
BV Visual Representation (Preview)
BV Data Sample
Learnings (from Teach Me)
Custom Calculations (Report-level Calc)
Predictions on BV
BV Refresh
Export/ Download Business View
Share Business View
URL in Business View
Request Edit Access
Projects (Organize Content)
Monitor Tinace
Embed Tinace
Settings
About Tinace
User Profile
Admin Settings
Manage Users
Team (Users)
Details & Role
Create a new user
Edit user details
Assigning the user data to another user
Restricting the dataset for a user
Deleting a user
Assign User Objects
Teammates (Groups)
Authentication & Authorization
Application & Advanced Settings
Data
Machine Learning
Genius Insights
Usage tracking & Support
CDN
Download Business View, Dataset, and Insights for Live BV
Customize Help
Impersonate
Data Size Estimation and Calculation
Effective Sharing Permissions
Change Week Start Day
Dataflow Access
Enable In-memory operations on Live sources
Language Support
Administration
Setup & Configuration
Installation Guide
Kubernetes Setup
Tinace Architecture
Deployment Architecture
System Requirements
Installation Overview
On-Prem Deployment Instruction Set
AWS Marketplace
Autoscaling
Backup and Restore
Help & Support
Help and Support System
Guided Tours
Product Videos
Articles & Docs
FAQ
Provide Feedback
Connect with Tinace team
Support Process
Notifications
Getting Started Videos
Getting Started
Tinace Connect
Tinace Data Overview Video
Connecting to Flat Files Video
Connecting to Data Sources Video
Live Connections Video
Data Refresh and Scheduling Video
Tinace Prep
Getting Started with Tinace Prep Video
Transformations, Indicators, Signatures, Aggregations and Filters Video
SQL and Python Video
Working with Dates Video
Data Fusion Video
Business View Video
Business Mapping Video
Report Level Calculations Video
Writeback to DB
Natural Language Search
Getting Started with Search Video
How-To Search Video
Customizing Search Results Video
Search Interactions Video
Help Tinace Learn
Explore - Vizpads
Getting Started with Vizpads Video
Creating Vizpads Video
Creating and Configuring Visualizations Video
Viz-Level Interactions Video
Vizpad-Level Interactions Video
Auto Insights
Getting Started with Auto Insights Video
Discovery Insights Video
Segment Insights Video
Trend Insights Video
Comparison Insights Video
Iterate on Insights Video
Tinace Feed Video
Predict - ML Modeling
Getting Started with Predict Video
AutoML Configuration Video
AutoML Leaderboard Video
Point-n-Click Regression Video
Point-n-Click Classification Video
Point-n-Click Clustering Video
Point-n-Click Time Series Video
Point-n-Click PythonML Video
Explainable AI Video
PredictAPI Video
Apply ML Model Video
ML Refresh and Schedule Video
Admin
Best Practices & FAQs
- All Categories
- Search (Natural Language)
- How to Search
- Query
- Time Period Queries
Time Period Queries
 Updated
by Charudatta Mundale
Updated
by Charudatta Mundale
Using Time Period queries, you can simplify the process of creating time-consuming, complex queries. With these keywords, Tinace brings more flexibility for time-based search queries. With the following type of keywords, you can ask straightforward questions in Search.
- yearly
- quarterly
- monthly
- since/from a specific time period
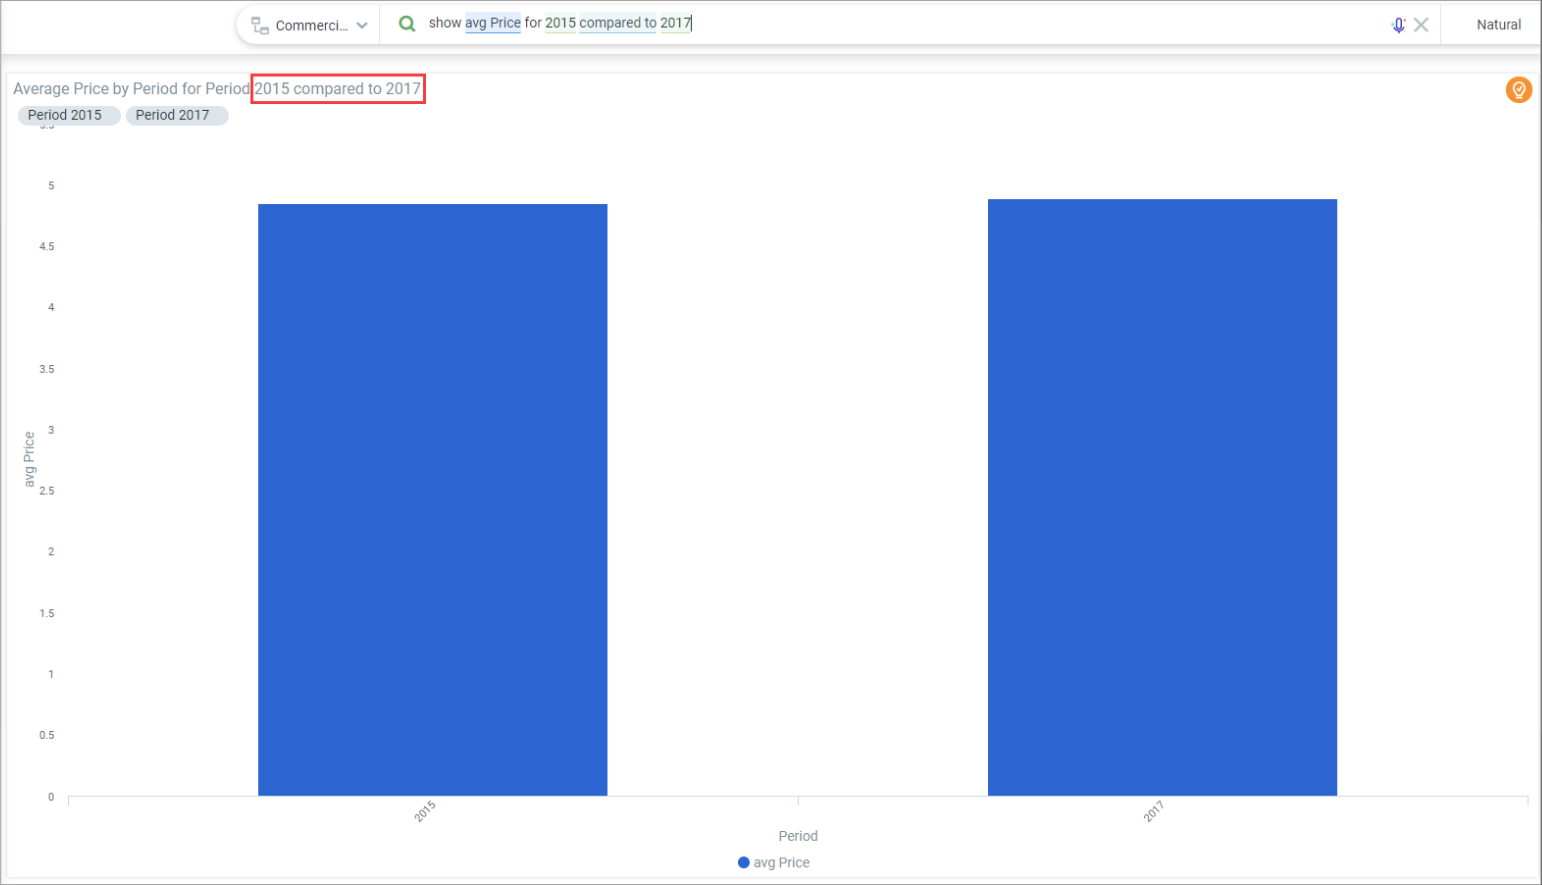
Sample search query using "yearly" keyword
- Show me the average price for 2015 compared to 2017
Calculates average price with yearly resolution and data filtered for 2015 and 2017.
Sample search query using "quarterly" keyword
- Show total Profit for Q2 2017 compared to Q1 2018
Calculates total Profit with quarterly resolution and data filtered for different quarters in different years.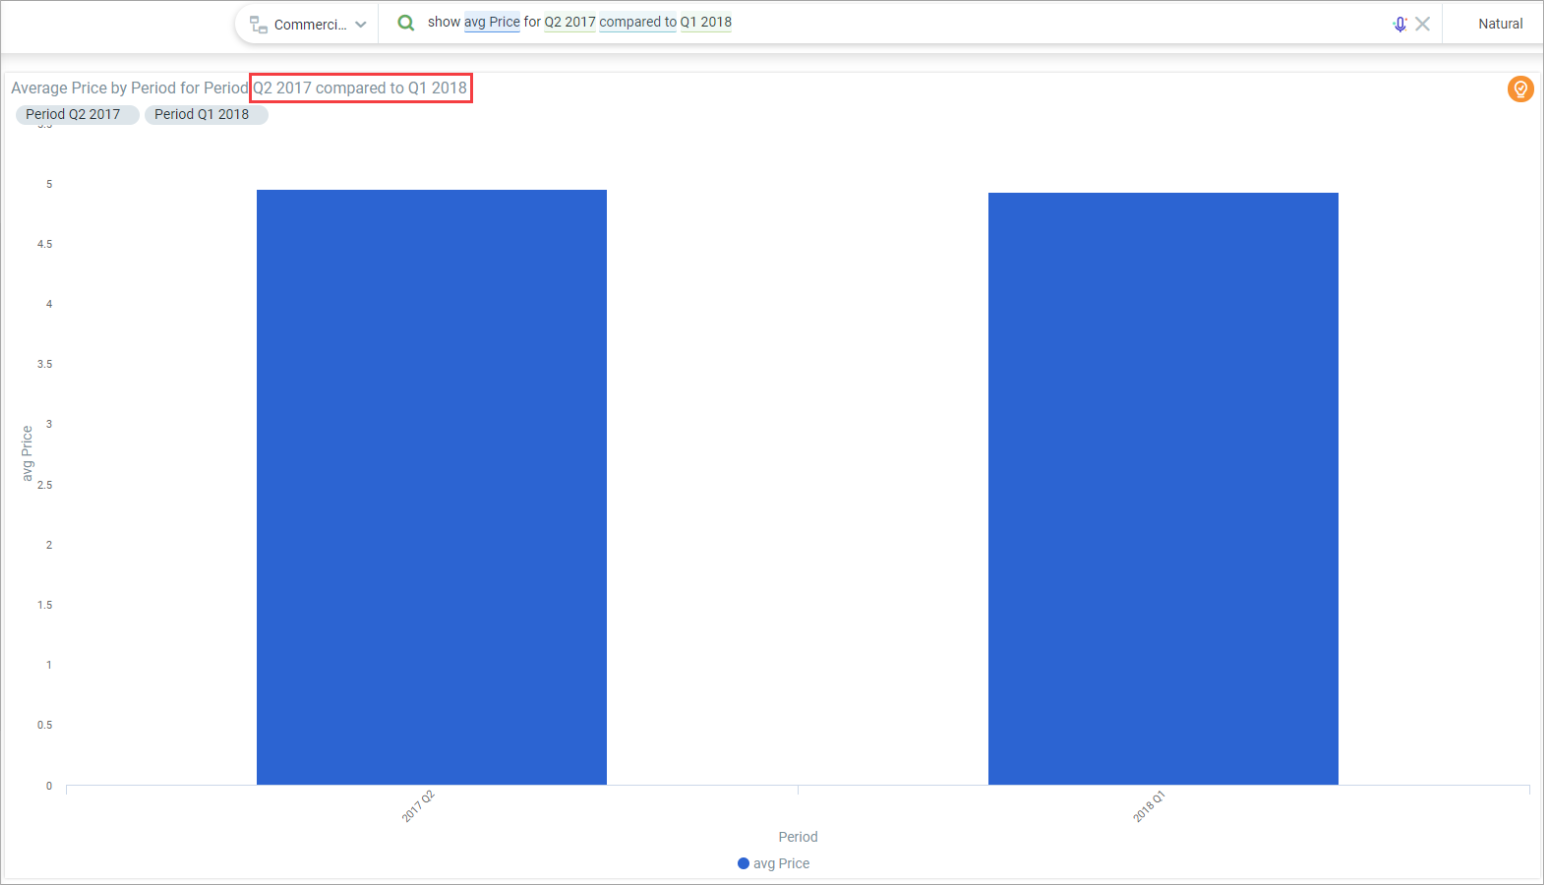
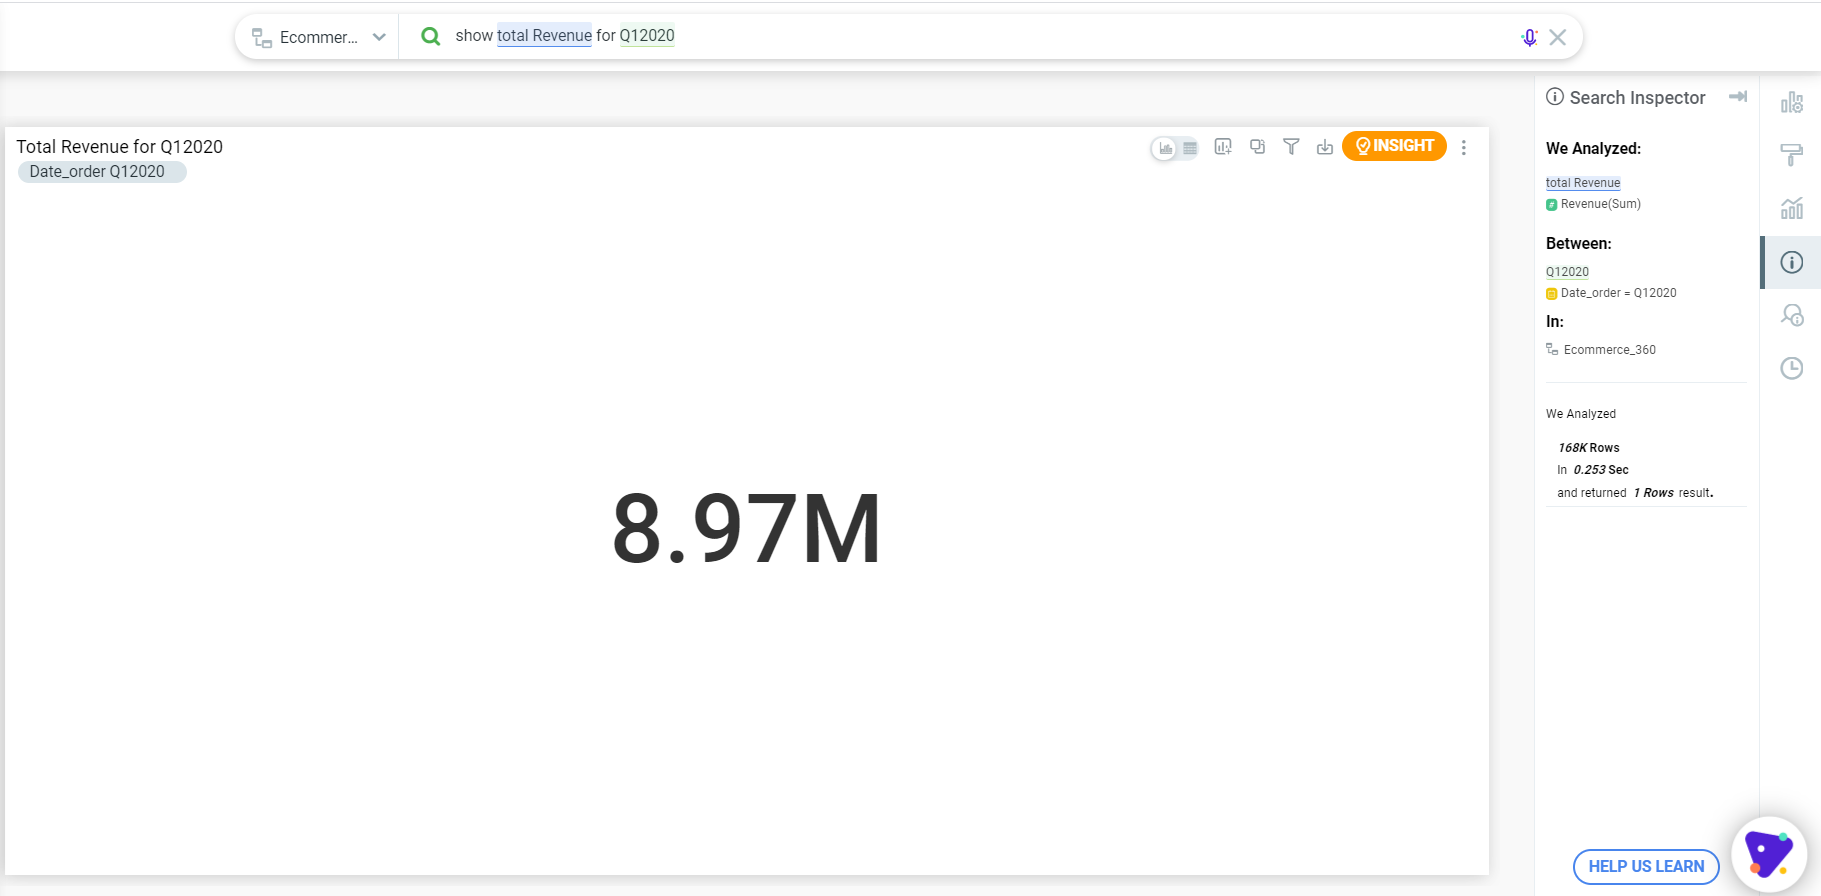
- Show total revenue for Q1 2020
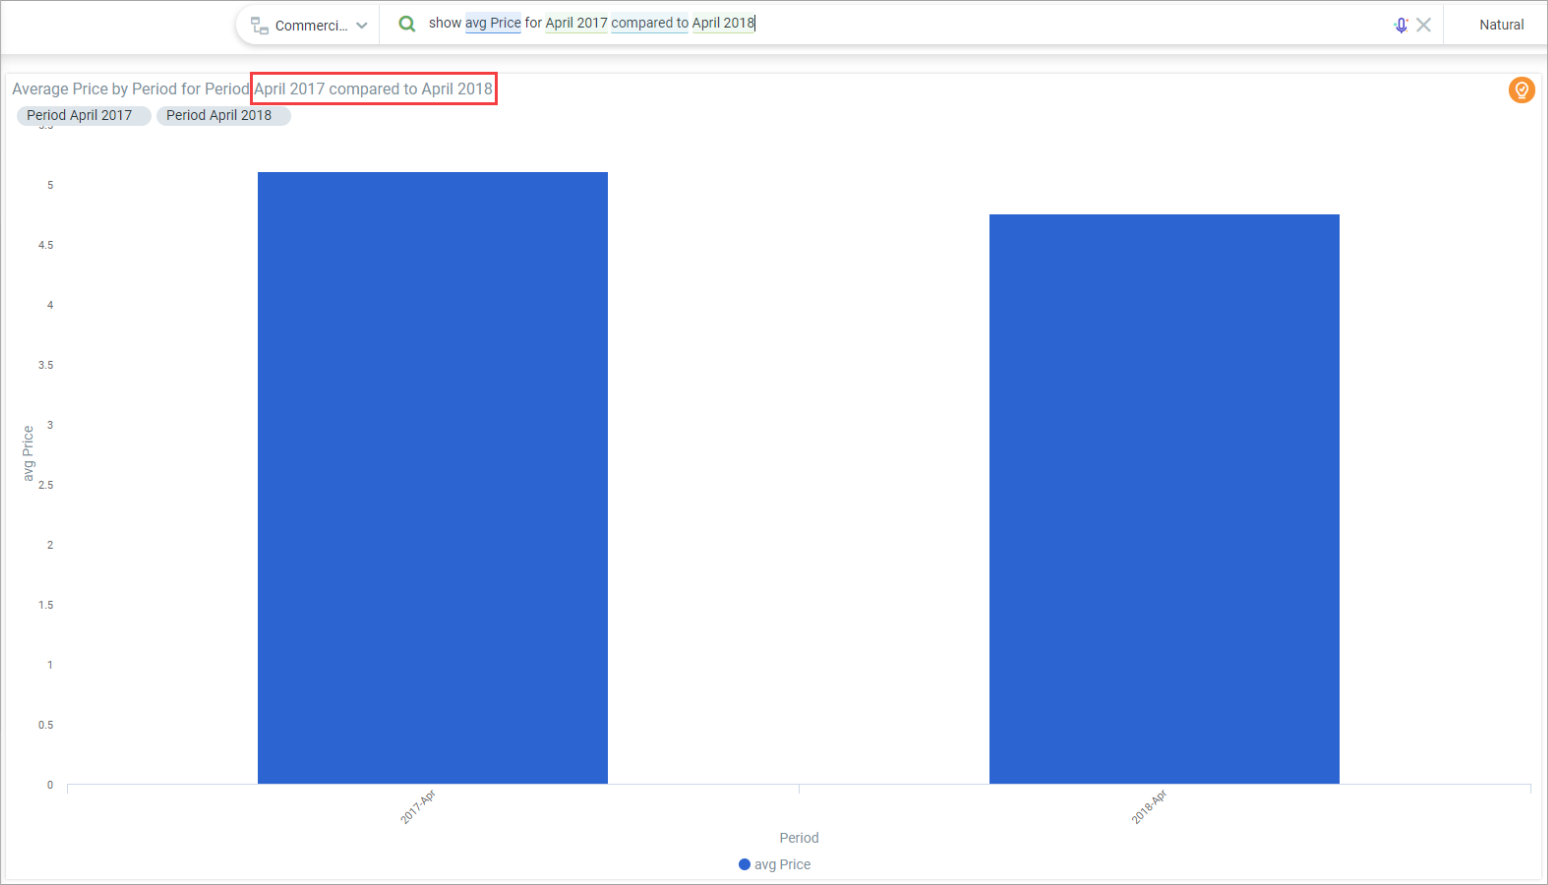
Sample search query using "monthly" keyword
- Show the total Profit for April 2017 compared to April 2018
Calculates total Profit with monthly resolution and data filtered for April 2017 and 2018.
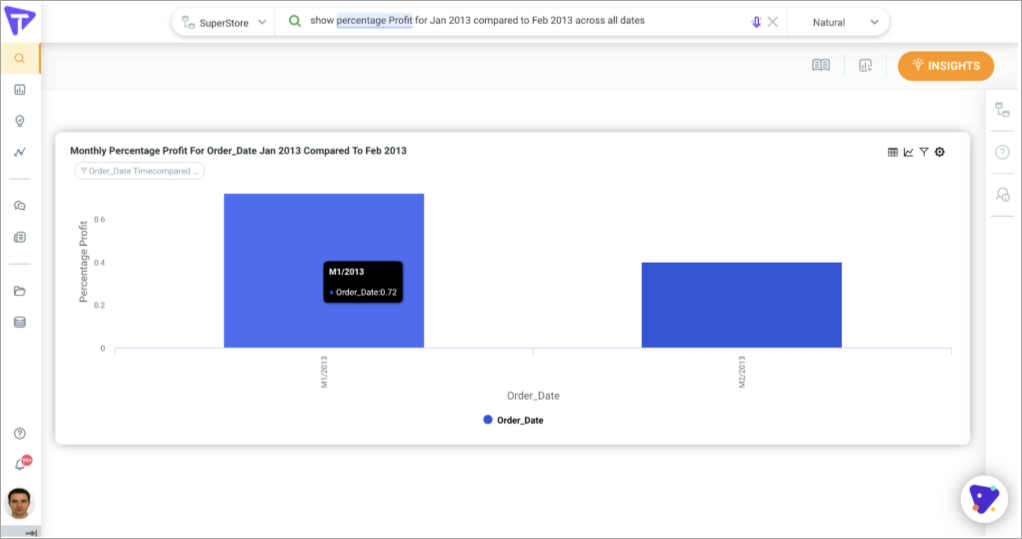
- Show percentage Profit for Jan 2013 compared to Feb 2013 across all dates
Calculates percentage Profit with monthly resolution and data filtered for Jan and Feb 2013, but the percentage is calculated across the complete time range.
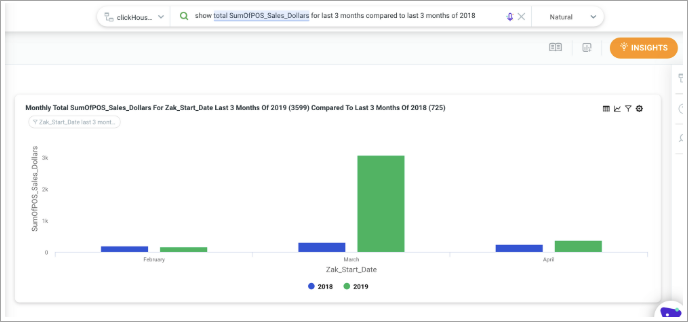
- Show total Profit for last 3 months compared to last 3 months of 2018
Calculates total Profit with monthly resolution and data filtered for (last 3 months from May) Feb, March and April of current year and 2018.
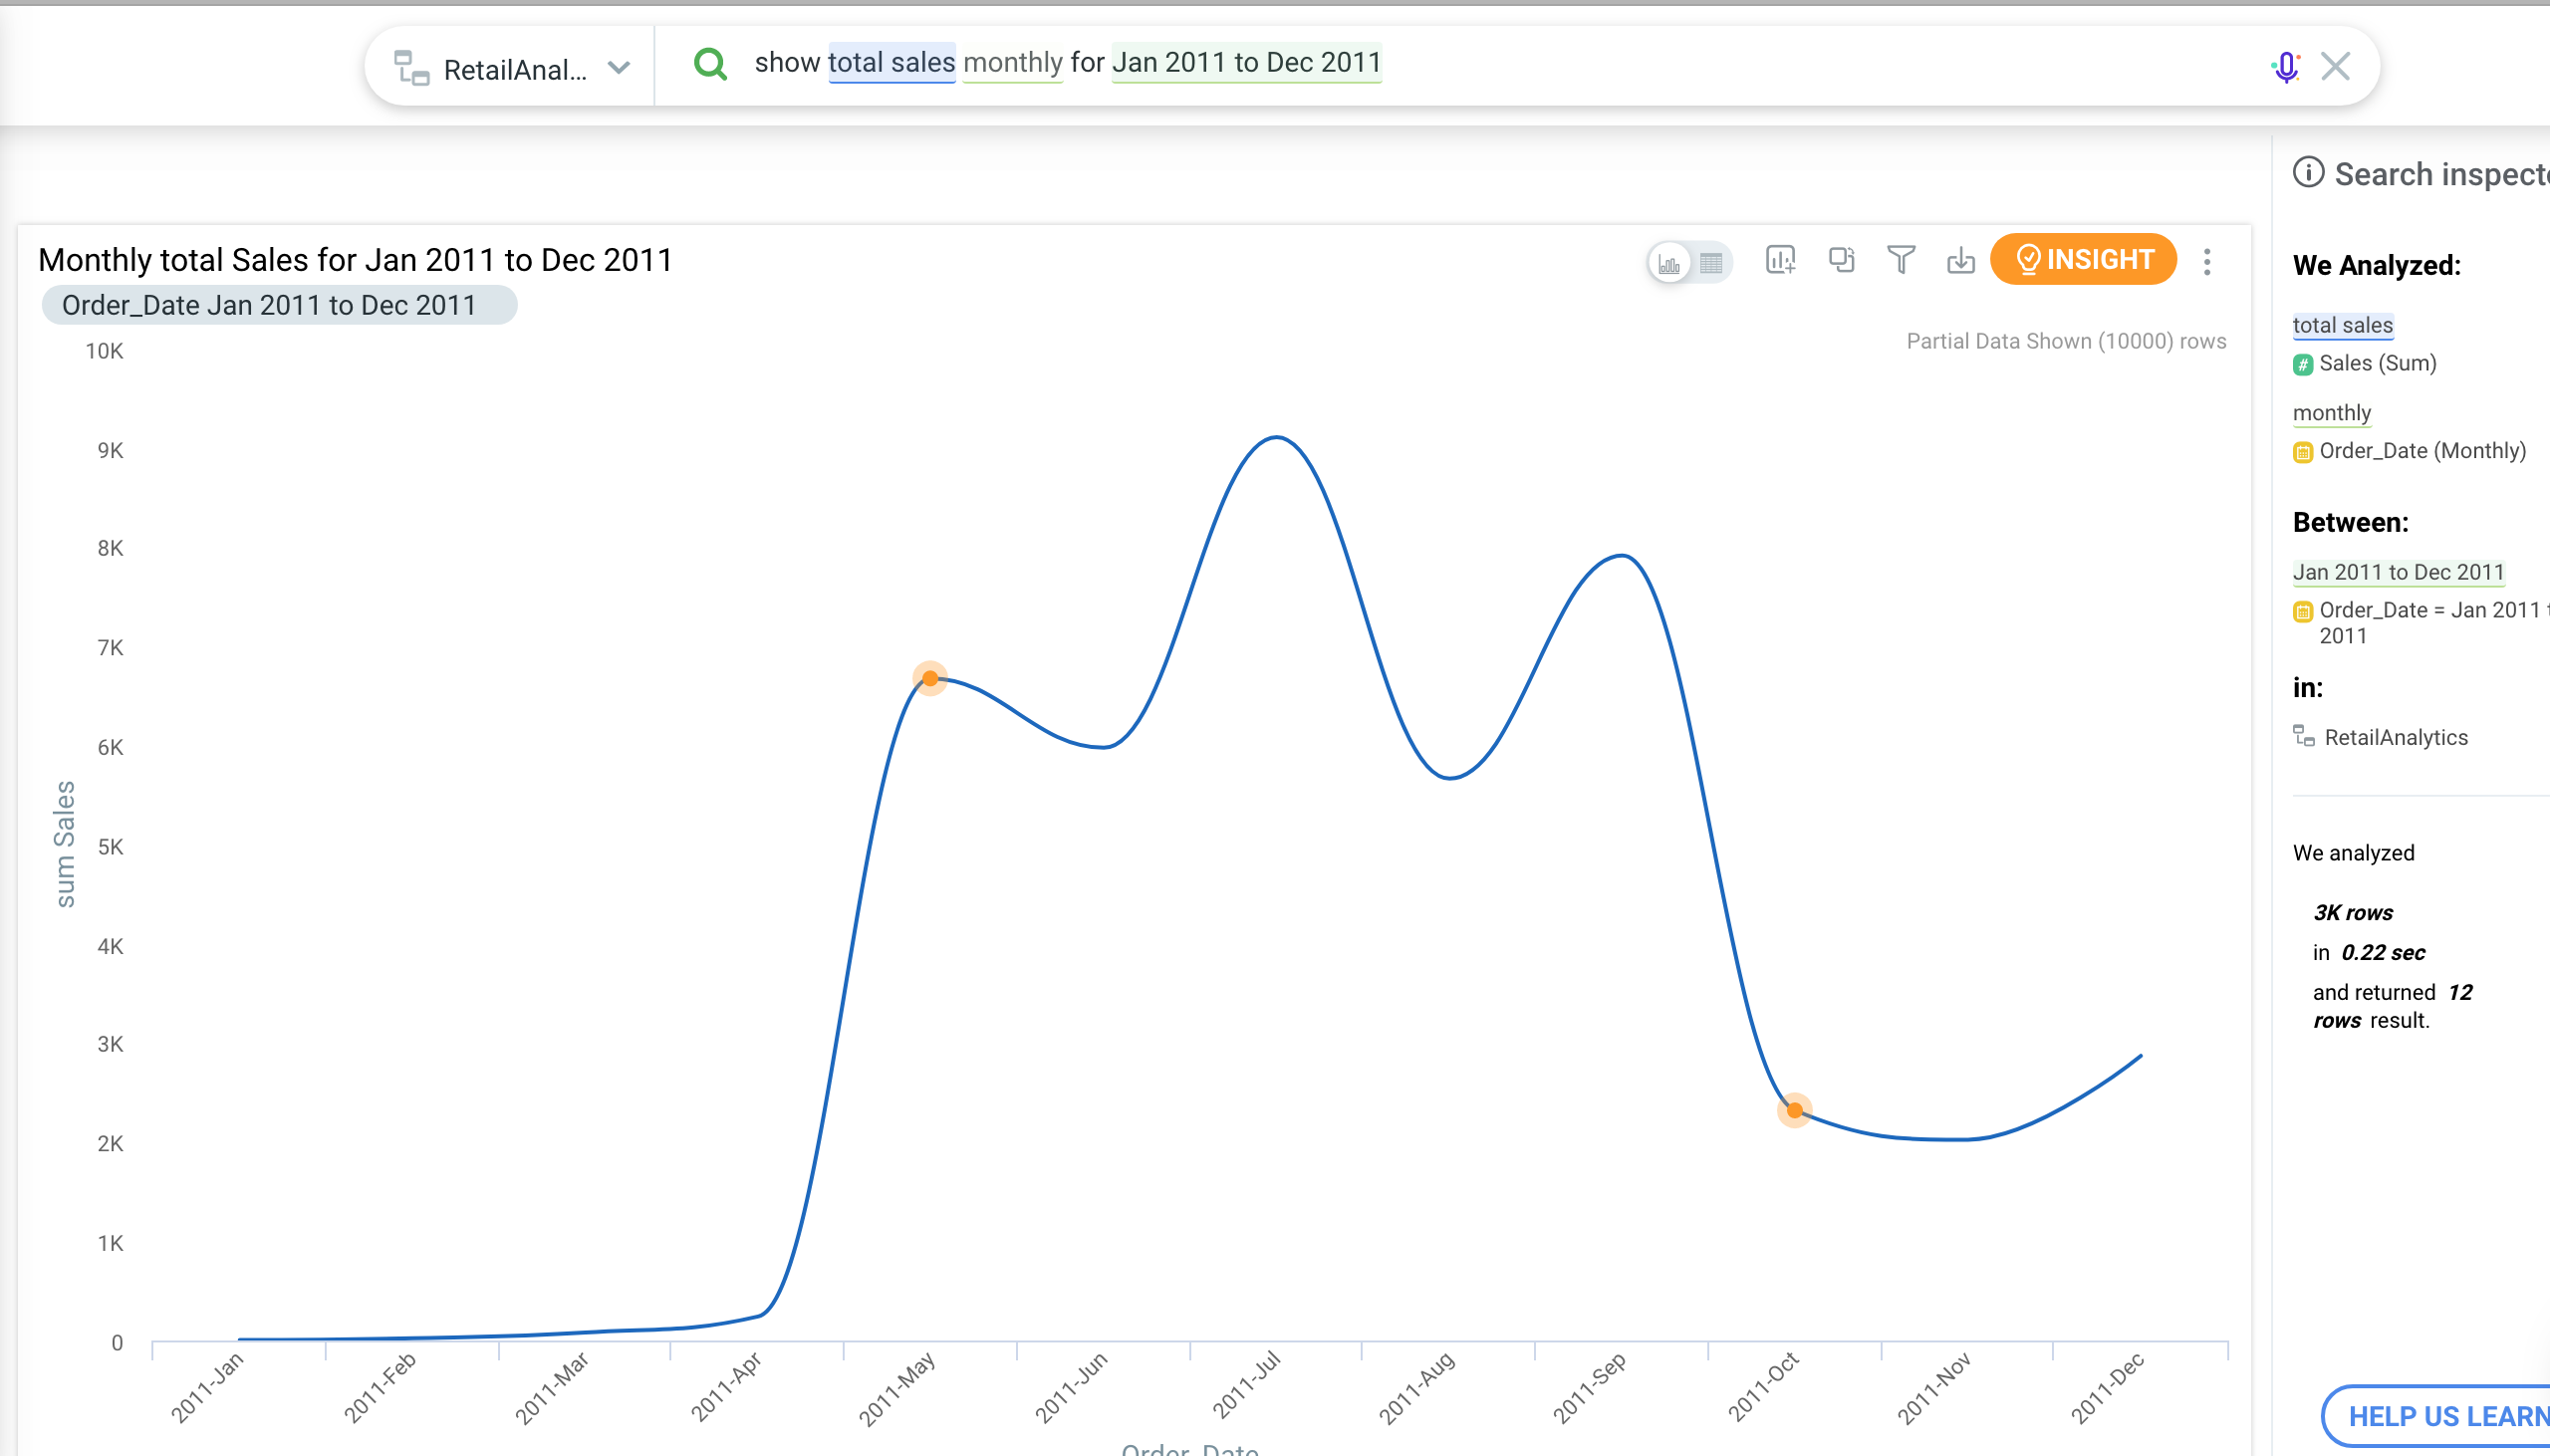
- Show total monthly sales for Jan 2011 to Dec 2011
Calculates the total sales with monthly resolution from Jan 2011 to Dec 2011.)
Sample search query using "since/from" keyword
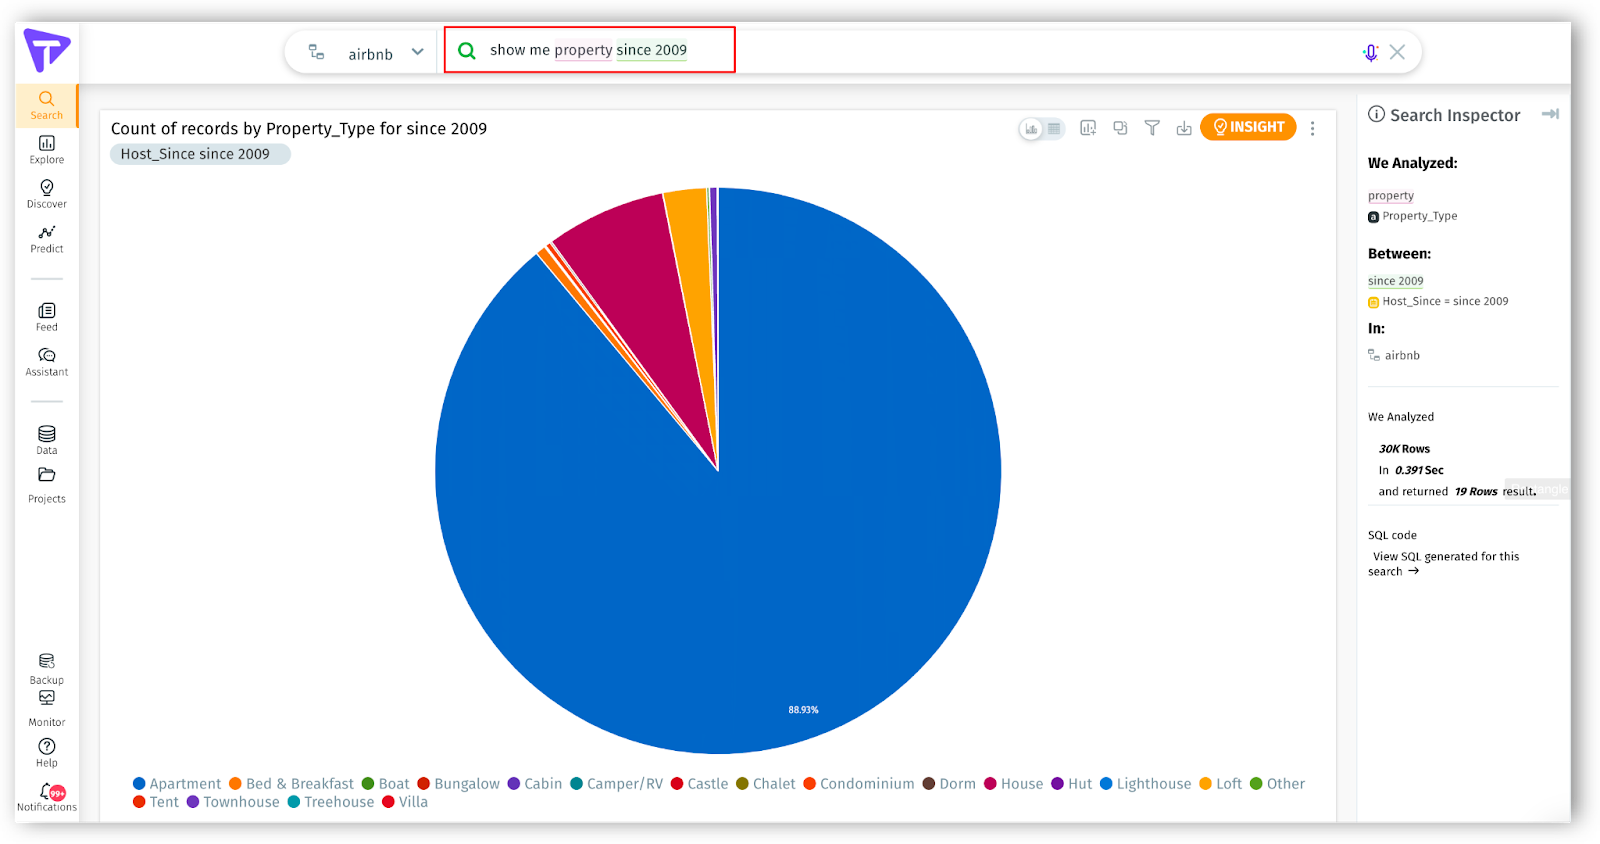
Since and From translate to the >= operator, which gets applied to the date/time value that follows.
- Show me property since 2009
More such examples:
- Show total sales monthly for Q1 2011 to Q4 2012
- Show total sales monthly for 2011 to 2013
- Show me products purchased since June 2017
- Show me inventory by region since 3/2/2021
- Profit in the United States since Feb 3, 2021