What's New
Release 4.0
Release 3.9
Release 3.8
Release 3.7
Release 3.6
Release 3.5
Release 3.4
Release 3.3
Release 3.2
Release 3.1
Release 3.0
Release 2.4.1
Release 2.4
Free Cloud Trial
Release 2.3
Release 2.2
Release 2.1
Release 2.0
Release 1.8
Release 1.7
Release 1.6
Release 1.5
Tinace Home
Search (Natural Language)
Search in Tinace
Guide Me
How to Search
Business View List / Columns
Query
Search Result
Discover Insights
Interactions
Chart Operations
Add to Vizpad
Table View
Switch Chart type
Change Chart Config
Apply Filters
Change Formatting
Measure Aggregation - Market Share Change
View Raw Data
Download/ Export
Embed URL
Partial Data for Visualization
Best-fit visual
Add to Vizpad
Adding the chart to a Vizpad
Customize the auto-picked columns
Search Query Inspector
Teach Tinace
History
Guided Search
Add Guided Search Experience
Display Names in the Search Guide
Guided Search
Guided Search Syntax and Attributes
Deep Dive
Search Synonyms
Maps in Search
Search Keywords
Percentage Queries
Time Period Queries
Year-over-Year Analysis
Additional Filters
Pagination
List View In Search Results
Embed Search
Personalized Search
Search Cheat Sheet
Filters in Help Tinace Learn
Explore (Vizpads)
Dashboards in Tinace
Vizpad Creation
Create Interactive Content
Create Visualization Charts
List of Charts
Common Chart Types
Line Chart
Bar Chart
Pie Chart
Year-over-Year Functionality in Vizpad
Area Chart
Combo Chart
Treemaps
Bubble Chart
Histogram
Heat-Map Charts
Scatter Chart
Other Charts
Cohort Chart
For each chart
Create Visualization Charts
Global Filters
Embedded Filters
Other Content
Creating Interactive Content
Vizpad level Interactions
Viz level Interactions
Discover Insights
Drivers
Discover hidden insights - Genius Insights
How Genius Insights works
Discoveries in Insight
Anomalies on Trend
Interactions
Chart Operations
Embedding Vizpad
Vizpad Consumption
Collection of Interactive Content
Vizpad level Interactions
Global Filter on the fly
Global Resolutions
Refresh
Notifications / Alerts
Share
Download / Export
Unique name for Vizpads
Edit Column Width
Viz level Interactions
Multi-Business View Vizpads
Embedding Viz & Vizpads
Discover (Genius Insights)
Discoveries
What are discoveries
Type of Discoveries in Tinace
Create Discoveries
Kick-off Key Drivers
Edit Insights
Key Driver Insights
Components of Key Drivers
What are Key Drivers
Edit Key Driver Insights
Segment Drivers
Trend Drivers
Trend Insights (Why Insights)
Comparison Insights
Components of Comparison Insights
Create Comparison Insight
What are Comparison Insights
Edit Comparison Insights
Others Actions
Save
Refresh
Share Insights
Download
Adding Insights to Vizpad
Insights Enhancements
Embedding Insight
Impact Calculation for Top Contributors
Marketshare
Live Insights
Predict (Machine Learning)
Machine Learning
AutoML
How to create AutoML models
Leaderboard
Prediction
Others
What is AutoML
Point-n-Click Predict
Feed (Track Metrics)
Assistant (Conversations)
Tinace on Mobile devices
Data (Connect, Transform, Model)
Connectors
Connector Setup
Edit Connector
Live Connect
Data Import
Cache
Direct Business View
JDBC connector for PrestoDB
Google BigQuery Connector
Snowflake
List of Connectors by Type
Tables Connections
Custom SQL
Schedule Connector Refresh
Share Connections
Datasets
Load Datasets
Configure Datasets (Measure/Dimensions)
Transform Datasets
Create Business View
Share Datasets
Copy Datasets
Delete Datasets
Data Prep
Datasets
Data Profiling / Statistics
Transformations
Dataset Transform
Aggregate Transforms
Calculated Columns
SQL Transform
Python Transform
Create Hierarchies
Filter Data
SQL Code Snippets
Multiple Datasets Scripting SQL
Column Transforms
Column Metadata
Column type
Feature type
Aggregation
Data type
Special Types
Synonym
Rename Column
Filter Column
Delete Column
Variable Display Names
Other Functions
Dataset Information
Dataset Preview
Alter Pipeline Stage
Edit / Publish Datasets
Data Pipeline (Visual)
Alerts
Partitioning for JDBC Datasets
Export Dataset
Data Fusion
Schedule Refresh
Business Views
Create Business View
Create Business View
Datasets Preview & List
Add datasets to Model
Joins
Column selection
Column configuration
Primary Date
Geo-tagging state/country/city
Save to Fast Query Engine
Publish
Business View
What is Data Model
BV Visual Representation (Preview)
BV Data Sample
Learnings (from Teach Me)
Custom Calculations (Report-level Calc)
Predictions on BV
BV Refresh
Export/ Download Business View
Share Business View
URL in Business View
Request Edit Access
Projects (Organize Content)
Monitor Tinace
Embed Tinace
Settings
About Tinace
User Profile
Admin Settings
Manage Users
Team (Users)
Details & Role
Create a new user
Edit user details
Assigning the user data to another user
Restricting the dataset for a user
Deleting a user
Assign User Objects
Teammates (Groups)
Authentication & Authorization
Application & Advanced Settings
Data
Machine Learning
Genius Insights
Usage tracking & Support
CDN
Download Business View, Dataset, and Insights for Live BV
Customize Help
Impersonate
Data Size Estimation and Calculation
Effective Sharing Permissions
Change Week Start Day
Dataflow Access
Enable In-memory operations on Live sources
Language Support
Administration
Setup & Configuration
Installation Guide
Kubernetes Setup
Tinace Architecture
Deployment Architecture
System Requirements
Installation Overview
On-Prem Deployment Instruction Set
AWS Marketplace
Autoscaling
Backup and Restore
Help & Support
Help and Support System
Guided Tours
Product Videos
Articles & Docs
FAQ
Provide Feedback
Connect with Tinace team
Support Process
Notifications
Getting Started Videos
Getting Started
Tinace Connect
Tinace Data Overview Video
Connecting to Flat Files Video
Connecting to Data Sources Video
Live Connections Video
Data Refresh and Scheduling Video
Tinace Prep
Getting Started with Tinace Prep Video
Transformations, Indicators, Signatures, Aggregations and Filters Video
SQL and Python Video
Working with Dates Video
Data Fusion Video
Business View Video
Business Mapping Video
Report Level Calculations Video
Writeback to DB
Natural Language Search
Getting Started with Search Video
How-To Search Video
Customizing Search Results Video
Search Interactions Video
Help Tinace Learn
Explore - Vizpads
Getting Started with Vizpads Video
Creating Vizpads Video
Creating and Configuring Visualizations Video
Viz-Level Interactions Video
Vizpad-Level Interactions Video
Auto Insights
Getting Started with Auto Insights Video
Discovery Insights Video
Segment Insights Video
Trend Insights Video
Comparison Insights Video
Iterate on Insights Video
Tinace Feed Video
Predict - ML Modeling
Getting Started with Predict Video
AutoML Configuration Video
AutoML Leaderboard Video
Point-n-Click Regression Video
Point-n-Click Classification Video
Point-n-Click Clustering Video
Point-n-Click Time Series Video
Point-n-Click PythonML Video
Explainable AI Video
PredictAPI Video
Apply ML Model Video
ML Refresh and Schedule Video
Admin
Best Practices & FAQs
Table of Contents
- All Categories
- Predict (Machine Learning)
- Machine Learning
- List of ML Models supported
List of ML Models supported
 Updated
by Hardik Chheda
Updated
by Hardik Chheda
Tinace supports various machine learning models through the Point-n-Click mode based on your data in business views and goals for your business.
These models are designed in such a way that you do not need any prior programming knowledge to perform the analytics on your data.
For better user experience, Tinace provides the same user interface for creating all types of ML models.
Tinace Machine learning models are divided into four steps:
- Feature transform
- Model selection
- Evaluate model
- Use the models
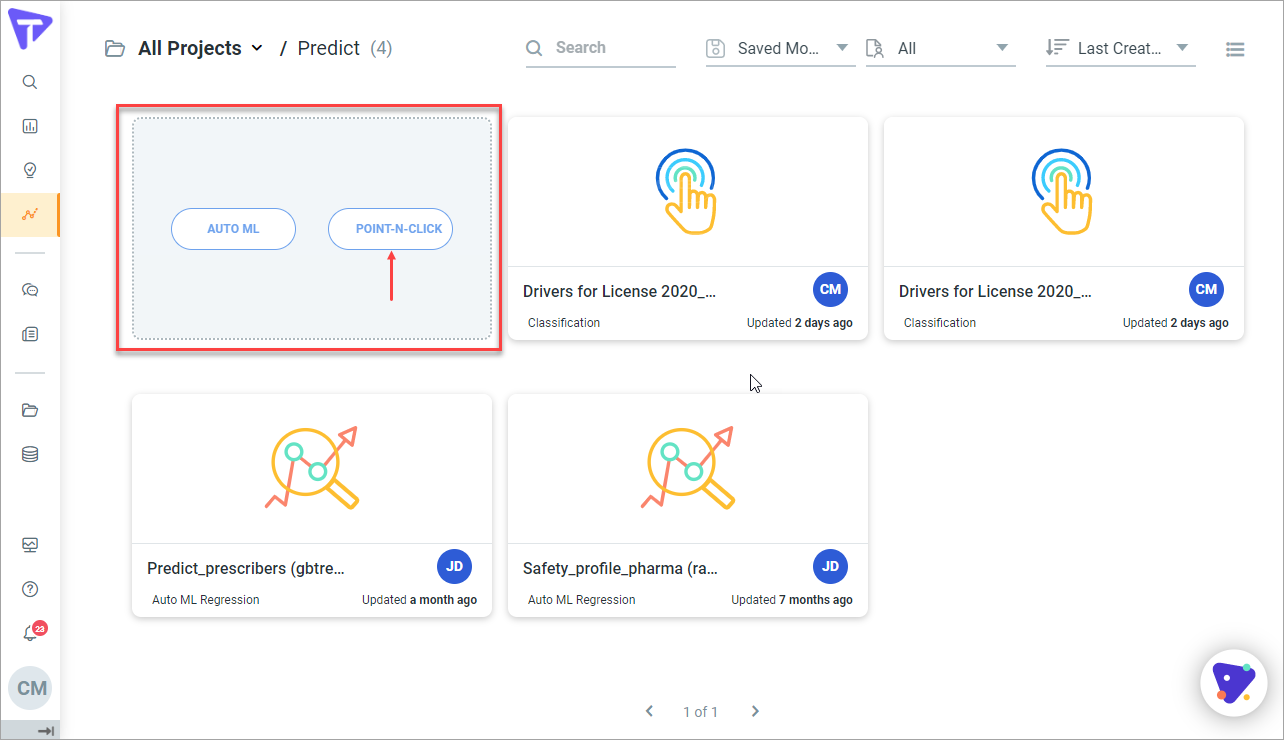
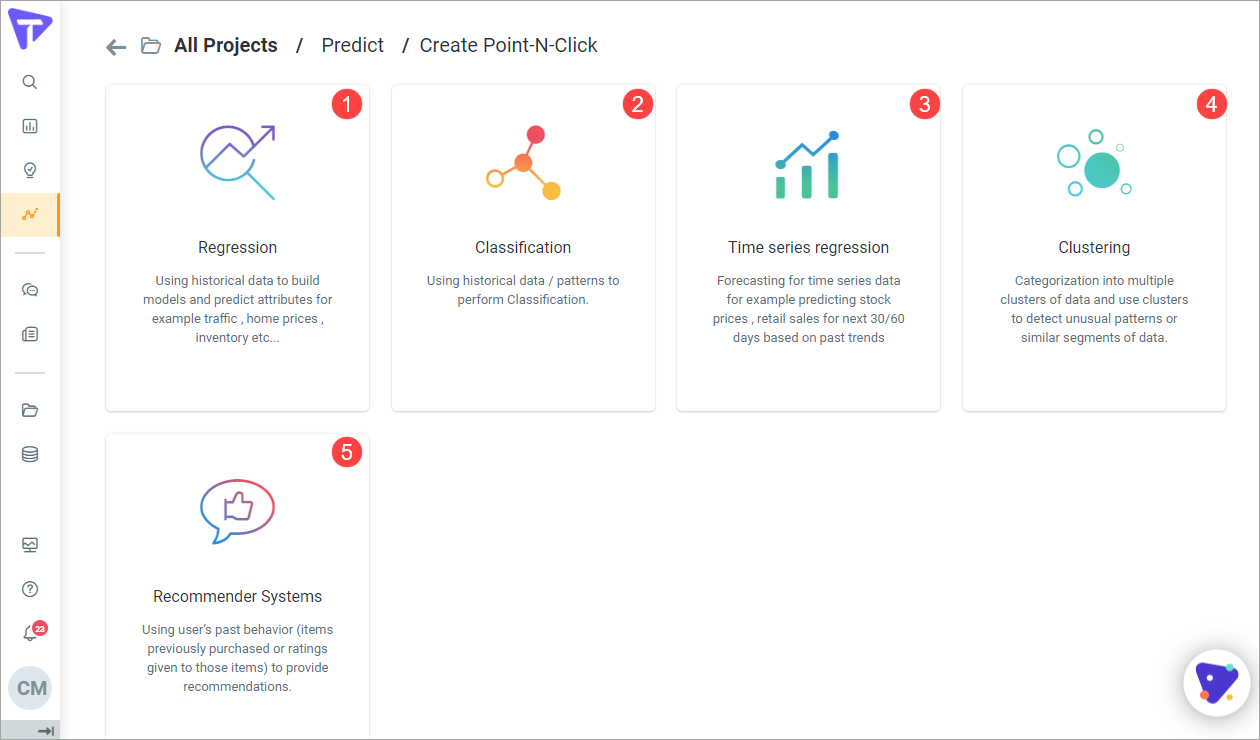
To find the ML models, navigate to Point-n-Click and select the ML model that works best for your business.
Tinace supports following four type of machine learning models with lots of model in each of these sections.
- Regression
- Classification
- Time series regression
- Clustering
- Recommender Systems
Regression
ML models for regression predicts a numeric value. In this model, Tinace uses historical data to build models and predict the attributes, for example, traffic, home price, inventory, and so on.
Supported algorithms
For training regression models, Tinace ML models use the following industry-standard learning algorithm:
- Linear Regression: This is an approach for modeling a relationship between the dimensions or features and one or more measures.
- Tree Regression: This is a decision support tool that uses a tree-like graph or model of decisions and their possible consequences.
- Linear Regression with Regularization: This is an approach same as Linear Regression with addition process of introducing additional information to prevent overfitting, which is one of the most common tasks to fit a "model" to a set of training data.
- Python Regression:
- GLM Regression: The generalized linear model (GLM) is a flexible generalization of conventional linear regression that allows the linear model to be related to the response variable through link function and the magnitude of the variance of each measurement to be the function of its predicted value. You can perfrom the GLM regression on binary outcome data, count data, probability data, proportion data and many other data types.
- XGBoost Regression:
- XGBoost Logistic Regression:
Examples of Regression model:
- "What will the temperature be in Seattle tomorrow?"
- "For this product, how many units will sell?"
- "What price will this house sell for?"
Classification
In this model, Tinace uses historical data/ patterns to perform classification. Tinace supports binary classification, multiclass variable classification models.
Supported algorithms
For training classification models, Tinace ML models use the following industry-standard learning algorithm:
- Decision Tree Classifier: Decision Tree Classifier is a simple and widely used classification technique, which applies an idea to solve the classification problem.
- Naive Bayes: Naive Bayes is a family of simple probablistic classifier based on applying Bayes theorm with strong (naive) independence assumptions between the features.
- Logistic regression: Logistic regression is simple technique where the dependent variable is categorical.
- Artificial Neural Network Classifier: An artificial neural network is an interconnected group of nodes, akin to the vast network of neurons in a brain. Here, each node represents an artificial neuron and an arrow represents a connection from the output of one neuron to the input of another.
- Random Forest Classifier: Random Forest Classifier are an ensemble learning method for classification, regression, and other tasks, that operate by constructing a multitude of decision trees at training time and outputting the class that is the mode of the classes (classification) or mean prediction (regression) of the individual trees.
- GBT Classifier: Gradient-Boosted Trees (GBTs) is a learning algorithm for classification. It supports binary labels, as well as both continuous and categorical features.
- GLM Classifier
- Linear Support Vector Machine
Examples of Classification model
- "Is this email spam or not spam?"
- "Will the customer buy this product?"
- "Is this review written by a customer or a robot?"
Time series regression
In this model, Tinace performs the forecasting for time series data, for example, predicting stock prices, retail sales for next 30 to 60 days based on past trends.This model is similar to the regression model, except that you can perform the time base predictive analytics of your data.
Supported algorithms
For training regression models, Tinace ML models use the following industry-standard learning algorithm:
- ETS Regression: ETS (Error, Trend, Seasonal/Exponential Smoothing) provides an automatic way of selecting best Exponential Smoothing method from 30 separate models in ETS framework.
- ARIMA Regression: ARIMA Regression model can be considered as a special type of regression model, in which the dependent variable (dimension/ feature) has been stationed and the independent variables (measures) are all lags of the dependent variable and/or lags of the errors.
- STLM Regression: Applies a STL decomposition (seasonal, trend, and error components using Loess - Loess is a non-linear regression technique)
- NAIVE: The NAIVE algorithm is a classification technique based on Bayes' Theorem with an assumption of independence among features. In simple terms, a Naive Bayes classifier assumes that the presence of a particular feature in a class is unrelated to the presence of any other feature.
- Seasonal NAIVE
- DRIFT: DRIFT means that the statistical properties of the target variable, which the model is trying to predict, change over time in unforeseen ways. This causes problems because the predictions become less accurate as time passes.
- TBATS: A TBATS algorithm could be considered as a time series decomposition method that allows multiple complex seasonalities to be incorporated simultaneously. For example, there may be a weekly seasonal component and a monthly seasonal component which both need to be incorporated into the forecast model.
- Neural Networks: Neural Network (NN) is an information-processing paradigm that is inspired by the way biological nervous systems, such as the brain, process information.
Examples of Time Series Regression model
- Rate of unemployment for last 10 years
- Rate of price inflation measured by quarterly percentage change in the price index at an annual rate
Clustering
Cluster analysis or clustering is the task of grouping a set of objects in such a way that objects in the same group (called as a cluster) are more similar (in some way or another) to each other than to those in other groups (clusters).
In this model, Tinace performs the categorization of multiple clusters and use that clusters to detect unusual patterns or similar segments of data.
Supported algorithms
For training regression models, Tinace ML models use the following industry-standard learning algorithm:
- K Clustering: K Clustering is a method of vector quantization, originally from signal processing, that is popular for cluster analysis in data mining.
- Bisecting K-Means: Bisecting k-Means is like a combination of k-Means and hierarchical clustering. It starts with all objects in a single cluster.
After creating clustering models (using K clustering or bisecting K-means algorithm), the label_prediction (the column that displays the label of different clusters) would be created as a dimension. When the model is applied to the required Business View to create a dataset, then the dataset will contain label_prediction as a dimension with String datatype.
Examples of Clustering model
- Discovering distinct groups in customer bases, and then using that knowledge to develop targeted marketing programs
- Identifying groups of motor insurance policy holders with a high average claim cost
- Identifying groups of houses according to their house type, value, and geographical location
Recommender Systems
A recommender system or a recommendation system (sometimes replacing "system" with a synonym such as platform or engine) is a subclass of information filtering system that seeks to predict the "rating" or "preference" that a user would give to an item.
You specify Rating column, User column and item column in the feature transform menu.