What's New
Release 4.0
Release 3.9
Release 3.8
Release 3.7
Release 3.6
Release 3.5
Release 3.4
Release 3.3
Release 3.2
Release 3.1
Release 3.0
Release 2.4.1
Release 2.4
Free Cloud Trial
Release 2.3
Release 2.2
Release 2.1
Release 2.0
Release 1.8
Release 1.7
Release 1.6
Release 1.5
Tinace Home
Search (Natural Language)
Search in Tinace
Guide Me
How to Search
Business View List / Columns
Query
Search Result
Discover Insights
Interactions
Chart Operations
Add to Vizpad
Table View
Switch Chart type
Change Chart Config
Apply Filters
Change Formatting
Measure Aggregation - Market Share Change
View Raw Data
Download/ Export
Embed URL
Partial Data for Visualization
Best-fit visual
Add to Vizpad
Adding the chart to a Vizpad
Customize the auto-picked columns
Search Query Inspector
Teach Tinace
History
Guided Search
Add Guided Search Experience
Display Names in the Search Guide
Guided Search
Guided Search Syntax and Attributes
Deep Dive
Search Synonyms
Maps in Search
Search Keywords
Percentage Queries
Time Period Queries
Year-over-Year Analysis
Additional Filters
Pagination
List View In Search Results
Embed Search
Personalized Search
Search Cheat Sheet
Filters in Help Tinace Learn
Explore (Vizpads)
Dashboards in Tinace
Vizpad Creation
Create Interactive Content
Create Visualization Charts
List of Charts
Common Chart Types
Line Chart
Bar Chart
Pie Chart
Year-over-Year Functionality in Vizpad
Area Chart
Combo Chart
Treemaps
Bubble Chart
Histogram
Heat-Map Charts
Scatter Chart
Other Charts
Cohort Chart
For each chart
Create Visualization Charts
Global Filters
Embedded Filters
Other Content
Creating Interactive Content
Vizpad level Interactions
Viz level Interactions
Discover Insights
Drivers
Discover hidden insights - Genius Insights
How Genius Insights works
Discoveries in Insight
Anomalies on Trend
Interactions
Chart Operations
Embedding Vizpad
Vizpad Consumption
Collection of Interactive Content
Vizpad level Interactions
Global Filter on the fly
Global Resolutions
Refresh
Notifications / Alerts
Share
Download / Export
Unique name for Vizpads
Edit Column Width
Viz level Interactions
Multi-Business View Vizpads
Embedding Viz & Vizpads
Discover (Genius Insights)
Discoveries
What are discoveries
Type of Discoveries in Tinace
Create Discoveries
Kick-off Key Drivers
Edit Insights
Key Driver Insights
Components of Key Drivers
What are Key Drivers
Edit Key Driver Insights
Segment Drivers
Trend Drivers
Trend Insights (Why Insights)
Comparison Insights
Components of Comparison Insights
Create Comparison Insight
What are Comparison Insights
Edit Comparison Insights
Others Actions
Save
Refresh
Share Insights
Download
Adding Insights to Vizpad
Insights Enhancements
Embedding Insight
Impact Calculation for Top Contributors
Marketshare
Live Insights
Predict (Machine Learning)
Machine Learning
AutoML
How to create AutoML models
Leaderboard
Prediction
Others
What is AutoML
Point-n-Click Predict
Feed (Track Metrics)
Assistant (Conversations)
Tinace on Mobile devices
Data (Connect, Transform, Model)
Connectors
Connector Setup
Edit Connector
Live Connect
Data Import
Cache
Direct Business View
JDBC connector for PrestoDB
Google BigQuery Connector
Snowflake
List of Connectors by Type
Tables Connections
Custom SQL
Schedule Connector Refresh
Share Connections
Datasets
Load Datasets
Configure Datasets (Measure/Dimensions)
Transform Datasets
Create Business View
Share Datasets
Copy Datasets
Delete Datasets
Data Prep
Datasets
Data Profiling / Statistics
Transformations
Dataset Transform
Aggregate Transforms
Calculated Columns
SQL Transform
Python Transform
Create Hierarchies
Filter Data
SQL Code Snippets
Multiple Datasets Scripting SQL
Column Transforms
Column Metadata
Column type
Feature type
Aggregation
Data type
Special Types
Synonym
Rename Column
Filter Column
Delete Column
Variable Display Names
Other Functions
Dataset Information
Dataset Preview
Alter Pipeline Stage
Edit / Publish Datasets
Data Pipeline (Visual)
Alerts
Partitioning for JDBC Datasets
Export Dataset
Data Fusion
Schedule Refresh
Business Views
Create Business View
Create Business View
Datasets Preview & List
Add datasets to Model
Joins
Column selection
Column configuration
Primary Date
Geo-tagging state/country/city
Save to Fast Query Engine
Publish
Business View
What is Data Model
BV Visual Representation (Preview)
BV Data Sample
Learnings (from Teach Me)
Custom Calculations (Report-level Calc)
Predictions on BV
BV Refresh
Export/ Download Business View
Share Business View
URL in Business View
Request Edit Access
Projects (Organize Content)
Monitor Tinace
Embed Tinace
Settings
About Tinace
User Profile
Admin Settings
Manage Users
Team (Users)
Details & Role
Create a new user
Edit user details
Assigning the user data to another user
Restricting the dataset for a user
Deleting a user
Assign User Objects
Teammates (Groups)
Authentication & Authorization
Application & Advanced Settings
Data
Machine Learning
Genius Insights
Usage tracking & Support
CDN
Download Business View, Dataset, and Insights for Live BV
Customize Help
Impersonate
Data Size Estimation and Calculation
Effective Sharing Permissions
Change Week Start Day
Dataflow Access
Enable In-memory operations on Live sources
Language Support
Administration
Setup & Configuration
Installation Guide
Kubernetes Setup
Tinace Architecture
Deployment Architecture
System Requirements
Installation Overview
On-Prem Deployment Instruction Set
AWS Marketplace
Autoscaling
Backup and Restore
Help & Support
Help and Support System
Guided Tours
Product Videos
Articles & Docs
FAQ
Provide Feedback
Connect with Tinace team
Support Process
Notifications
Getting Started Videos
Getting Started
Tinace Connect
Tinace Data Overview Video
Connecting to Flat Files Video
Connecting to Data Sources Video
Live Connections Video
Data Refresh and Scheduling Video
Tinace Prep
Getting Started with Tinace Prep Video
Transformations, Indicators, Signatures, Aggregations and Filters Video
SQL and Python Video
Working with Dates Video
Data Fusion Video
Business View Video
Business Mapping Video
Report Level Calculations Video
Writeback to DB
Natural Language Search
Getting Started with Search Video
How-To Search Video
Customizing Search Results Video
Search Interactions Video
Help Tinace Learn
Explore - Vizpads
Getting Started with Vizpads Video
Creating Vizpads Video
Creating and Configuring Visualizations Video
Viz-Level Interactions Video
Vizpad-Level Interactions Video
Auto Insights
Getting Started with Auto Insights Video
Discovery Insights Video
Segment Insights Video
Trend Insights Video
Comparison Insights Video
Iterate on Insights Video
Tinace Feed Video
Predict - ML Modeling
Getting Started with Predict Video
AutoML Configuration Video
AutoML Leaderboard Video
Point-n-Click Regression Video
Point-n-Click Classification Video
Point-n-Click Clustering Video
Point-n-Click Time Series Video
Point-n-Click PythonML Video
Explainable AI Video
PredictAPI Video
Apply ML Model Video
ML Refresh and Schedule Video
Admin
Best Practices & FAQs
- All Categories
- Search (Natural Language)
- Search in Tinace
- Natural Language Search
- What is Natural Search?
What is Natural Search?
 Updated
by Charudatta Mundale
Updated
by Charudatta Mundale
Natural search is the search in which the user interacts with the system through regular spoken language, similar to Google search, instead of a query language of restricted vocabulary used in other interfaces.
How Tinace handles the Natural search
As the Natural search involves a large vocabulary, it is not an easy task for teaching machines to understand how the user communicates to get the required information.
Tinace has developed a Search engine that can understand the natural language.
The Search bar is designed to highlight words in the search statement as you type them. These highlighted words act as clickable tokens relevant to the query format to find the best results.
Tinace has also focused on enhancing the user experience where the search quickly adapts to the questions from the user and assists them in getting exactly what they are looking for.
Additionally, Search is also provided with the ASR (Active Speech Recognition) integration. This ASR integration helps users to get the result by speaking the question instead of typing it.
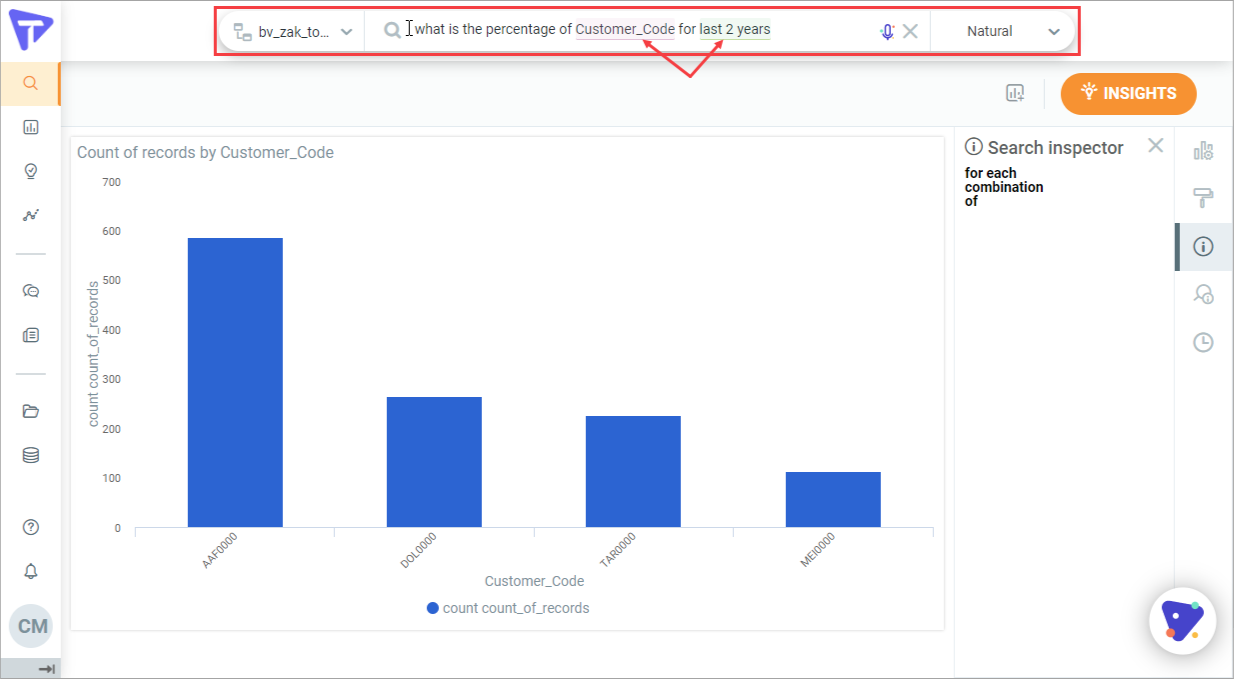
Search Interface
In the Search bar, click the colored tokens and select another option to change the original question to further analyze the data.
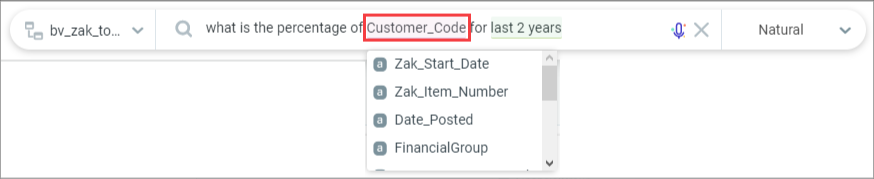
Tokenization
In the query, each highlighted word is stored and recognized as a token to help identify and render the most accurate results.
Auto correcting query
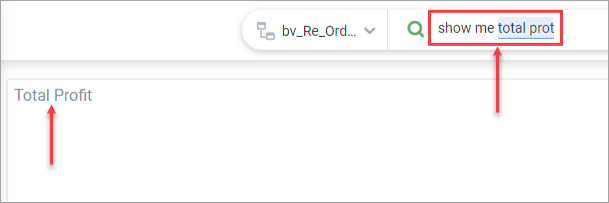
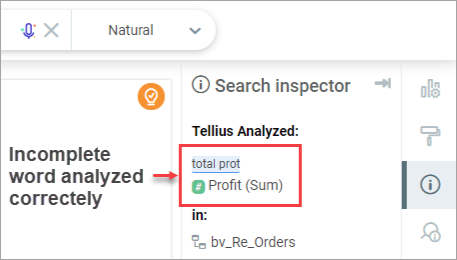
When you write a question in the Search bar, you may write it in a natural language. However, Tinace intelligently interprets the question and auto-corrects the question in a valid format that the system can understand to generate the analysis as expected.
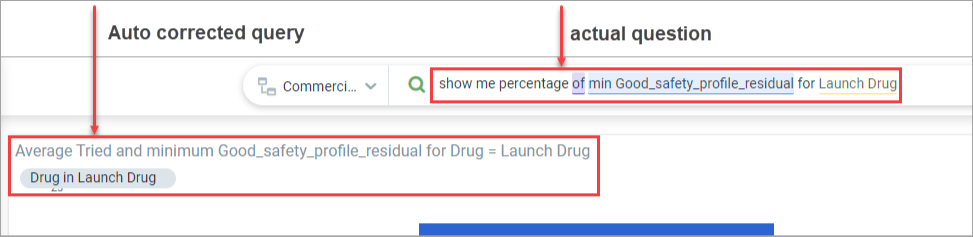
Even if the question is incomplete, Tinace interprets it correctly and displays the exact analysis as per the expectations.
Auto inference
The name inference indicates the reasoning involved in drawing a conclusion or making a logical judgment. Auto inference in Tinace is the way Tinace analyzes the question and instead of displaying chart for all queries, it also runs the insights for certain queries.
No Fixed Query Format
Being Natural language enabled, Tinace does not restrict you to write your question in a specific format. You can write your question in a human language and Tinace can interpret it correctly to display the exact analysis as per your expectations.
Voice Recognition, a hands-free search with voice
The Search bar provides the voice recognition option by which you can enter your question by speaking instead of typing.
Before you start speaking, you must click the mic icon and then start speaking your question.
Tinace recognizes the question correctly even if you take a pause in speaking. Tinace interprets the entered question even if it is incomplete. Once you restart speaking and complete the remaining query, Tinace again interprets the full question and generates the analysis.

Samples
Let's say we are looking at a Retail Dataset, and we wanted to see the list of our top selling brands in the country. How would you ask that question with Tinace?
Question: What are the worst performing products?
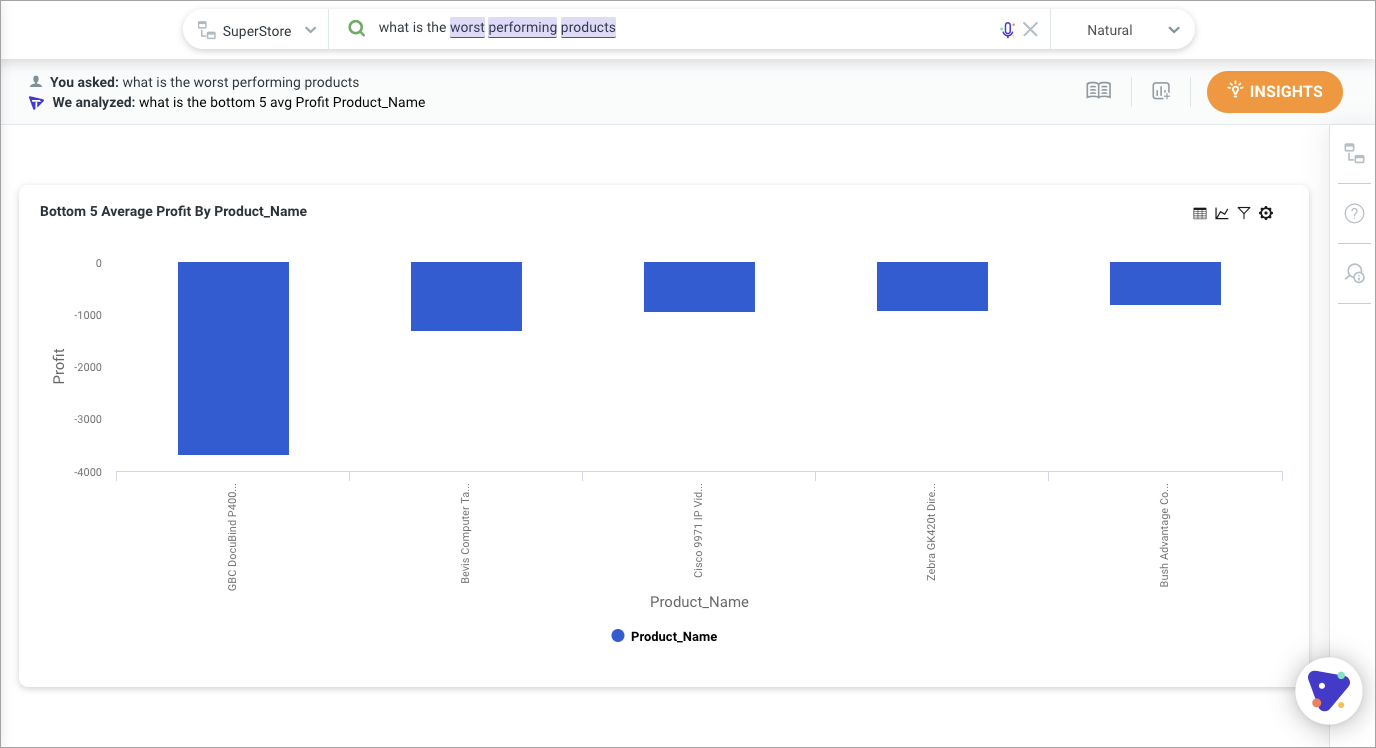
Answer: Tinace displays a chart that is most relevant to the question entered in the Search bar and provides details on how it identified the context. Tinace understands the natural language that the users speak or type. It identifies that performing is associated with profit metric in the dataset and the worst 5 refers to the bottom. While combining the entire question together, it understands that it needs to find the worst products with the least profit.
You can Teach Tinace the business lingo and context to receive better results and get accurate answers.
Question: Compare my sales in 2011 vs 2012
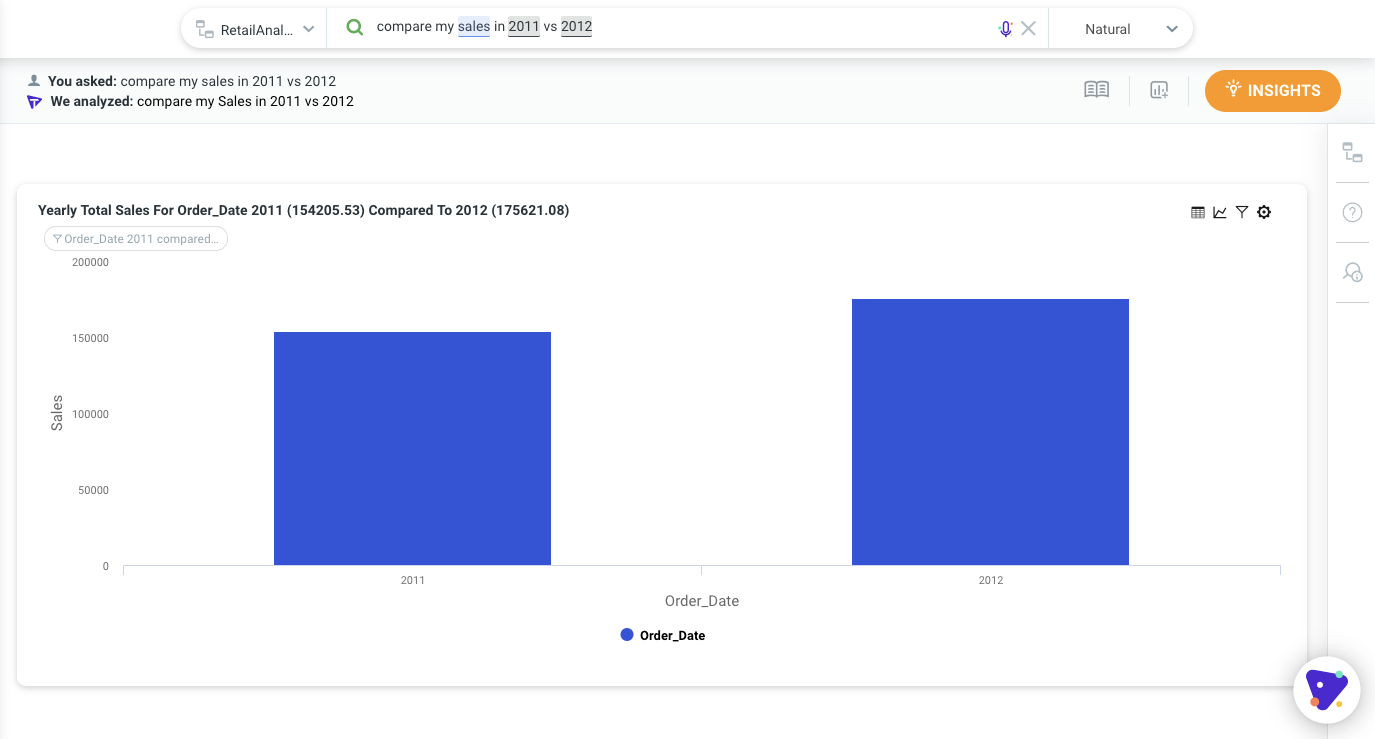
Answer: Tinace identified that you wanted to compare and contrast the sales between the 2 years. It understands that the best visual representation is a bar chart when users are comparing two different aspects.
If you are looking for a complete list of example Searches possible on Tinace, you can navigate here: Art of Possible on Search.
Search Enhancements
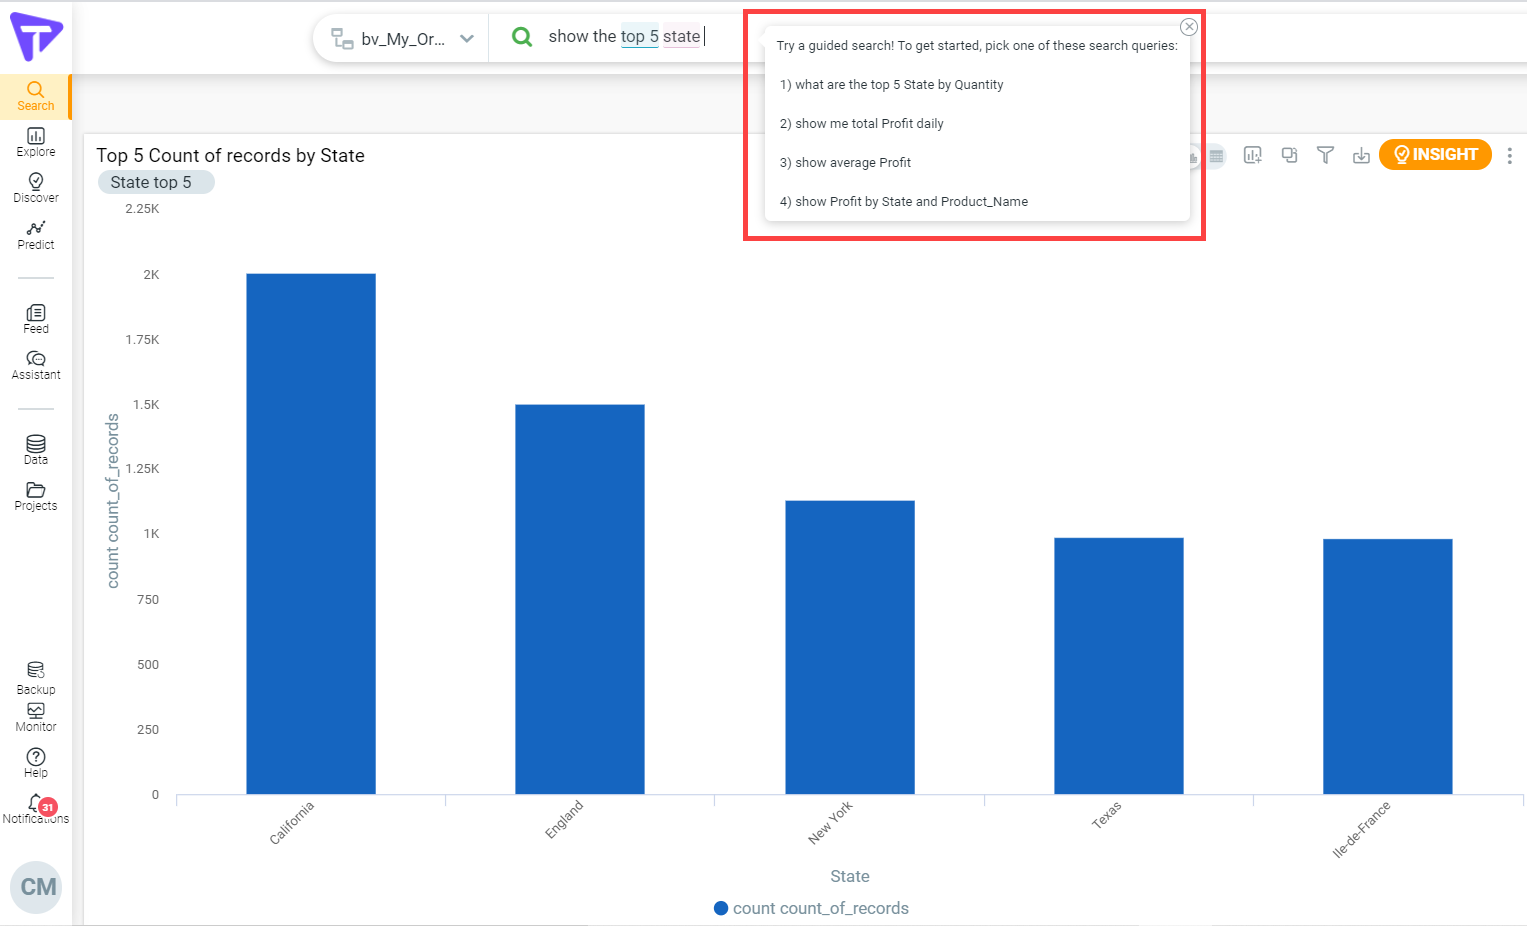
Add Guided Search Experience
The search functionality has now the added advantage of adding existing search suggestions from Search Guide to the query to auto-complete it. You now get suggestions based on history, next-word suggestions, auto-generated questions/suggestions from the system. This is very helpful, especially if you are a new user since it not only helps in formulating a query but also gets new suggestions for the query.
Initiate the Guided Search Experience
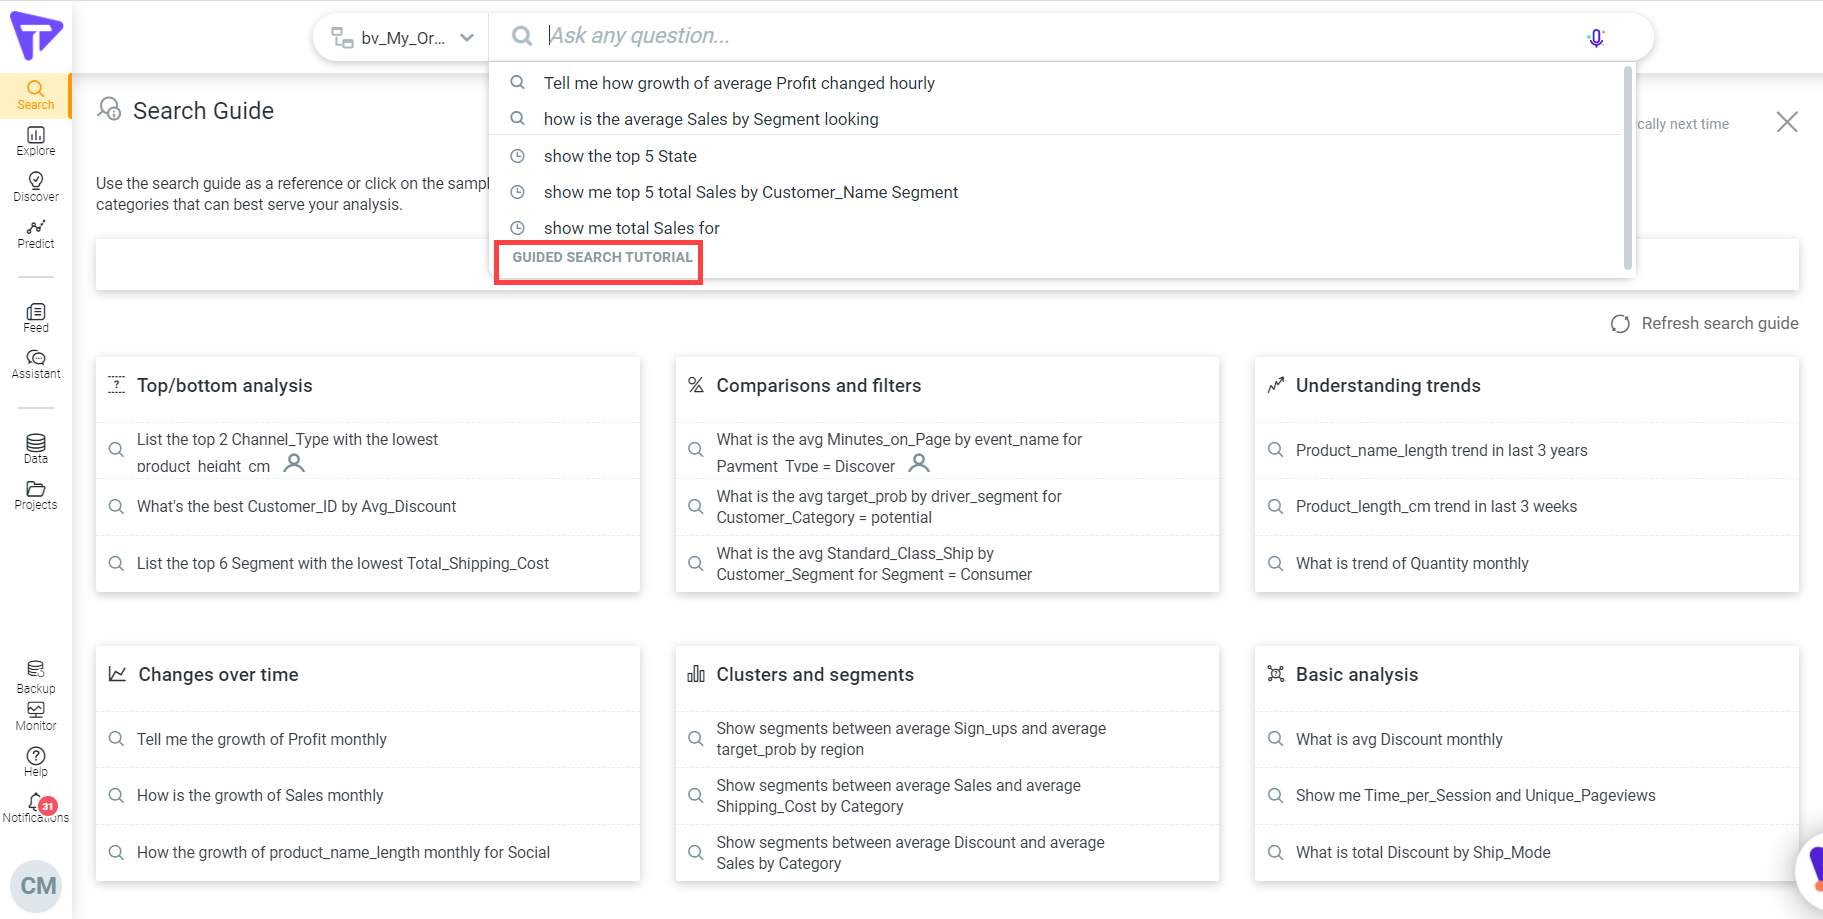
Guided Search in Action