What's New
Release 4.0
Release 3.9
Release 3.8
Release 3.7
Release 3.6
Release 3.5
Release 3.4
Release 3.3
Release 3.2
Release 3.1
Release 3.0
Release 2.4.1
Release 2.4
Free Cloud Trial
Release 2.3
Release 2.2
Release 2.1
Release 2.0
Release 1.8
Release 1.7
Release 1.6
Release 1.5
Tinace Home
Search (Natural Language)
Search in Tinace
Guide Me
How to Search
Business View List / Columns
Query
Search Result
Discover Insights
Interactions
Chart Operations
Add to Vizpad
Table View
Switch Chart type
Change Chart Config
Apply Filters
Change Formatting
Measure Aggregation - Market Share Change
View Raw Data
Download/ Export
Embed URL
Partial Data for Visualization
Best-fit visual
Add to Vizpad
Adding the chart to a Vizpad
Customize the auto-picked columns
Search Query Inspector
Teach Tinace
History
Guided Search
Add Guided Search Experience
Display Names in the Search Guide
Guided Search
Guided Search Syntax and Attributes
Deep Dive
Search Synonyms
Maps in Search
Search Keywords
Percentage Queries
Time Period Queries
Year-over-Year Analysis
Additional Filters
Pagination
List View In Search Results
Embed Search
Personalized Search
Search Cheat Sheet
Filters in Help Tinace Learn
Explore (Vizpads)
Dashboards in Tinace
Vizpad Creation
Create Interactive Content
Create Visualization Charts
List of Charts
Common Chart Types
Line Chart
Bar Chart
Pie Chart
Year-over-Year Functionality in Vizpad
Area Chart
Combo Chart
Treemaps
Bubble Chart
Histogram
Heat-Map Charts
Scatter Chart
Other Charts
Cohort Chart
For each chart
Create Visualization Charts
Global Filters
Embedded Filters
Other Content
Creating Interactive Content
Vizpad level Interactions
Viz level Interactions
Discover Insights
Drivers
Discover hidden insights - Genius Insights
How Genius Insights works
Discoveries in Insight
Anomalies on Trend
Interactions
Chart Operations
Embedding Vizpad
Vizpad Consumption
Collection of Interactive Content
Vizpad level Interactions
Global Filter on the fly
Global Resolutions
Refresh
Notifications / Alerts
Share
Download / Export
Unique name for Vizpads
Edit Column Width
Viz level Interactions
Multi-Business View Vizpads
Embedding Viz & Vizpads
Discover (Genius Insights)
Discoveries
What are discoveries
Type of Discoveries in Tinace
Create Discoveries
Kick-off Key Drivers
Edit Insights
Key Driver Insights
Components of Key Drivers
What are Key Drivers
Edit Key Driver Insights
Segment Drivers
Trend Drivers
Trend Insights (Why Insights)
Comparison Insights
Components of Comparison Insights
Create Comparison Insight
What are Comparison Insights
Edit Comparison Insights
Others Actions
Save
Refresh
Share Insights
Download
Adding Insights to Vizpad
Insights Enhancements
Embedding Insight
Impact Calculation for Top Contributors
Marketshare
Live Insights
Predict (Machine Learning)
Machine Learning
AutoML
How to create AutoML models
Leaderboard
Prediction
Others
What is AutoML
Point-n-Click Predict
Feed (Track Metrics)
Assistant (Conversations)
Tinace on Mobile devices
Data (Connect, Transform, Model)
Connectors
Connector Setup
Edit Connector
Live Connect
Data Import
Cache
Direct Business View
JDBC connector for PrestoDB
Google BigQuery Connector
Snowflake
List of Connectors by Type
Tables Connections
Custom SQL
Schedule Connector Refresh
Share Connections
Datasets
Load Datasets
Configure Datasets (Measure/Dimensions)
Transform Datasets
Create Business View
Share Datasets
Copy Datasets
Delete Datasets
Data Prep
Datasets
Data Profiling / Statistics
Transformations
Dataset Transform
Aggregate Transforms
Calculated Columns
SQL Transform
Python Transform
Create Hierarchies
Filter Data
SQL Code Snippets
Multiple Datasets Scripting SQL
Column Transforms
Column Metadata
Column type
Feature type
Aggregation
Data type
Special Types
Synonym
Rename Column
Filter Column
Delete Column
Variable Display Names
Other Functions
Dataset Information
Dataset Preview
Alter Pipeline Stage
Edit / Publish Datasets
Data Pipeline (Visual)
Alerts
Partitioning for JDBC Datasets
Export Dataset
Data Fusion
Schedule Refresh
Business Views
Create Business View
Create Business View
Datasets Preview & List
Add datasets to Model
Joins
Column selection
Column configuration
Primary Date
Geo-tagging state/country/city
Save to Fast Query Engine
Publish
Business View
What is Data Model
BV Visual Representation (Preview)
BV Data Sample
Learnings (from Teach Me)
Custom Calculations (Report-level Calc)
Predictions on BV
BV Refresh
Export/ Download Business View
Share Business View
URL in Business View
Request Edit Access
Projects (Organize Content)
Monitor Tinace
Embed Tinace
Settings
About Tinace
User Profile
Admin Settings
Manage Users
Team (Users)
Details & Role
Create a new user
Edit user details
Assigning the user data to another user
Restricting the dataset for a user
Deleting a user
Assign User Objects
Teammates (Groups)
Authentication & Authorization
Application & Advanced Settings
Data
Machine Learning
Genius Insights
Usage tracking & Support
CDN
Download Business View, Dataset, and Insights for Live BV
Customize Help
Impersonate
Data Size Estimation and Calculation
Effective Sharing Permissions
Change Week Start Day
Dataflow Access
Enable In-memory operations on Live sources
Language Support
Administration
Setup & Configuration
Installation Guide
Kubernetes Setup
Tinace Architecture
Deployment Architecture
System Requirements
Installation Overview
On-Prem Deployment Instruction Set
AWS Marketplace
Autoscaling
Backup and Restore
Help & Support
Help and Support System
Guided Tours
Product Videos
Articles & Docs
FAQ
Provide Feedback
Connect with Tinace team
Support Process
Notifications
Getting Started Videos
Getting Started
Tinace Connect
Tinace Data Overview Video
Connecting to Flat Files Video
Connecting to Data Sources Video
Live Connections Video
Data Refresh and Scheduling Video
Tinace Prep
Getting Started with Tinace Prep Video
Transformations, Indicators, Signatures, Aggregations and Filters Video
SQL and Python Video
Working with Dates Video
Data Fusion Video
Business View Video
Business Mapping Video
Report Level Calculations Video
Writeback to DB
Natural Language Search
Getting Started with Search Video
How-To Search Video
Customizing Search Results Video
Search Interactions Video
Help Tinace Learn
Explore - Vizpads
Getting Started with Vizpads Video
Creating Vizpads Video
Creating and Configuring Visualizations Video
Viz-Level Interactions Video
Vizpad-Level Interactions Video
Auto Insights
Getting Started with Auto Insights Video
Discovery Insights Video
Segment Insights Video
Trend Insights Video
Comparison Insights Video
Iterate on Insights Video
Tinace Feed Video
Predict - ML Modeling
Getting Started with Predict Video
AutoML Configuration Video
AutoML Leaderboard Video
Point-n-Click Regression Video
Point-n-Click Classification Video
Point-n-Click Clustering Video
Point-n-Click Time Series Video
Point-n-Click PythonML Video
Explainable AI Video
PredictAPI Video
Apply ML Model Video
ML Refresh and Schedule Video
Admin
Best Practices & FAQs
- All Categories
- Tinace Home
- Getting Started
- Finding your way around Tinace
Finding your way around Tinace
 Updated
by Charudatta Mundale
Updated
by Charudatta Mundale
Tinace provides a user-friendly web-based interface, making it easy to navigate around Tinace.
The following screen is the home page of the Tinace interface that displays the navigation bar, the dashboard, the search bar, and different panels for projects, vizpads, insights, and models.
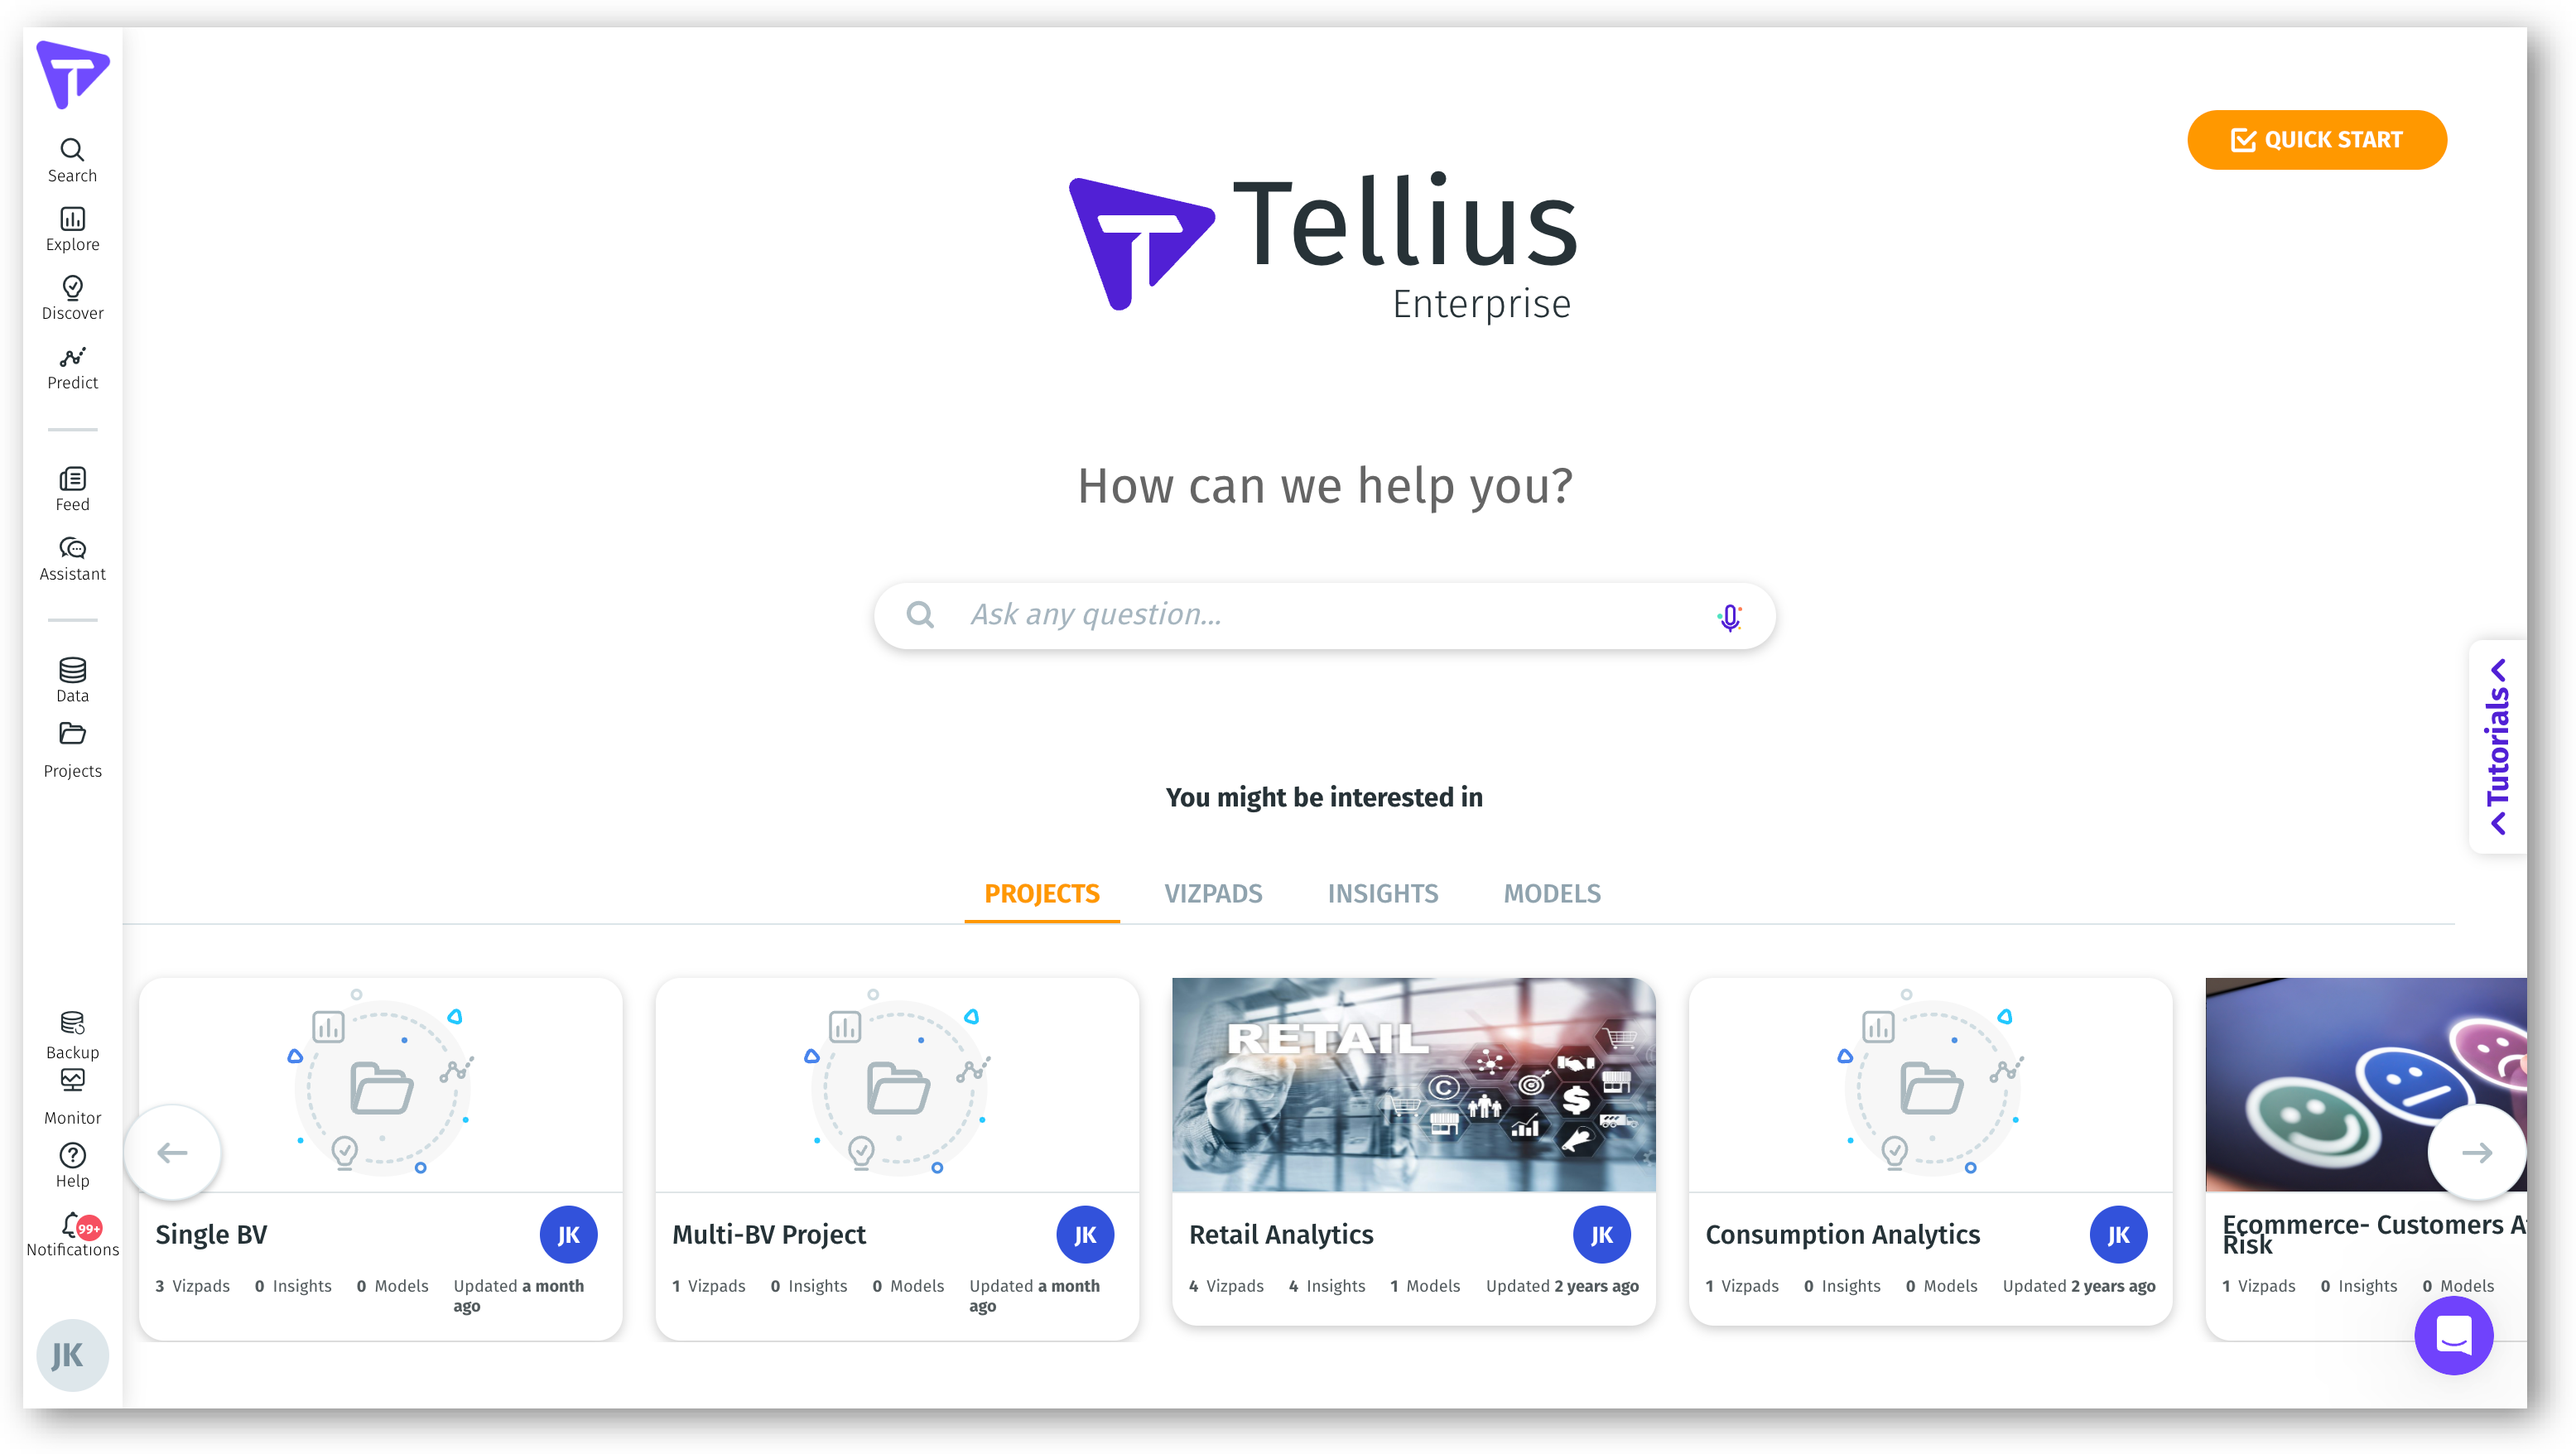
Navigation bar
On the left side of the screen, that navigation bar appears with an expand/collapse arrow to toggle between the menu icons and menu names and icons.
The navigation bar provides buttons for various options, such as Search, Dashboards, Insights, Predict Models, Projects, Data / Business Views, Notifications, and User Icon. You can click these buttons to navigate to the respective page.
Depending on the level of access given by your administrator, you will be able to navigate through the features.
Walkthrough Guides
When visiting major modules, the user will be provided with quick popup guides to help navigate through the interface.
There are walkthroughs for Home (overview), Business Views, Connect and Search.
Overview Videos
The Help page displays the Product Videos panel with the list of overview videos and product videos to get started with Tinace.
You can use these videos to learn how to search, gain insights and build machine models on Tinace. These videos also help bridging the gap of what users can achieve on Tinace with their data.
Try with your Dataset
Shortcut to help you create and load a new dataset or new data source with a click of a button on the home screen.
Search bar
Most of your questions can be answered through Search. On the Search page, you can either select your business view and then start typing your search query or just start typing the search query, and Tinace will automatically populate suggestions depending on your prompted search.
Search guide
The Search page provides a link to navigate to the Search Guide page. You can use the search guide as a reference or click on the sample questions to discover your data. The questions are organizes based on specific categories that can best serve your analysis.
Vizpads
Conduct visual exploration analysis and build combine multiple viz's into effective dashboards. Access all vizpads you've created or those shared with you from other members of the organization or teams.
Insights
Discover deeper level questions and future recommendations to best value your business goals. Access all insights you've created or those shared with you from other members of the organization or teams.
Predict
Look into the future, build models in easy via AutoML or Point-n-Click based on your current trends and data. Access all models you've created or those shared with you from other members of the organization or teams.
Assistant
Your personal assistant through a chatbot. The helper you need to get your analysis done along by your side. The assistant will provide suggestions and recommendations based on the context of the chat.
Feed
Automatic tracking of your important KPIs directly at your fingertips without asking further questions. Monitoring the relevant metrics that matter to you and your business.
Projects
Access all information, projects (organized folders) based on content separation. Projects are also known as data insights application.
Data
All your data options will be in this module, from connecting to data sources, uploading data to building business views, and scheduling data flow. Remember, the actions available are dependent on the access level given by your administrator.
Notifications
Displays the current status of the recently executed jobs. Each notification includes information, such as the date, time of when the job has started, the status of whether the job is successful or failed, and view job options.
User Icon
Indicates the current user account logged onto Tinace. It contains profile setting options. The administrator users have various other viewing and advanced setting options to assign a role to specific users.
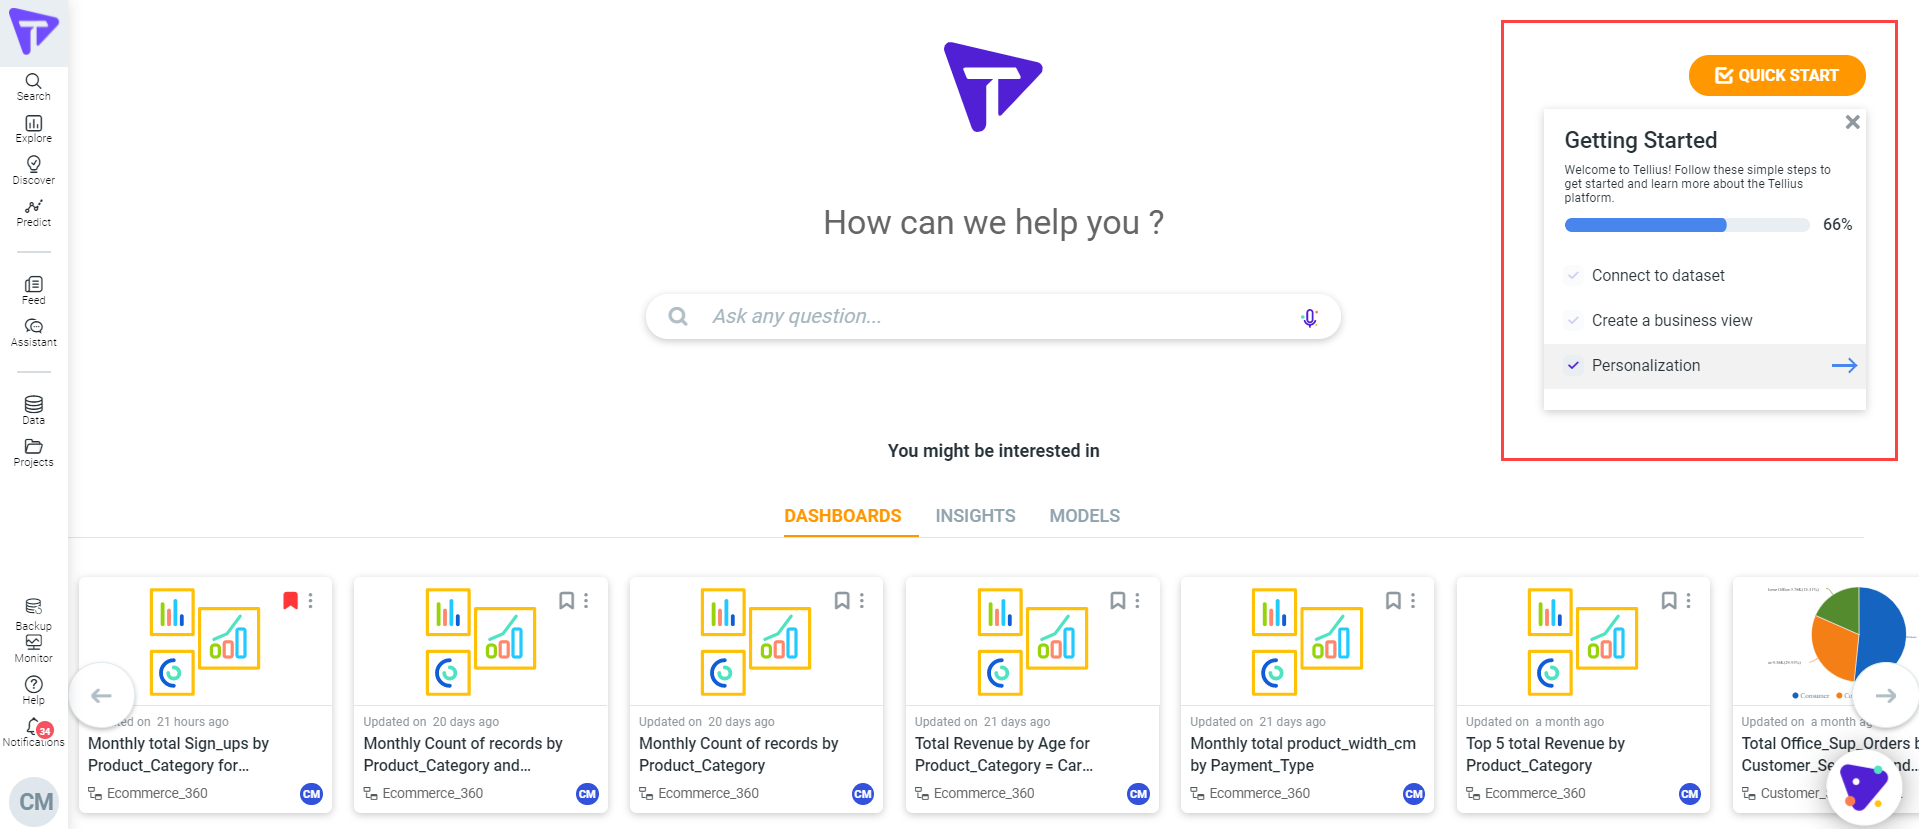
Quick Start
By clicking the Quick Start button on the Tinace home page, users will complete a workflow where they explicitly define the Business Views to be used, the dimensions, measures, time resolutions, filters, types of questions they are interested in.
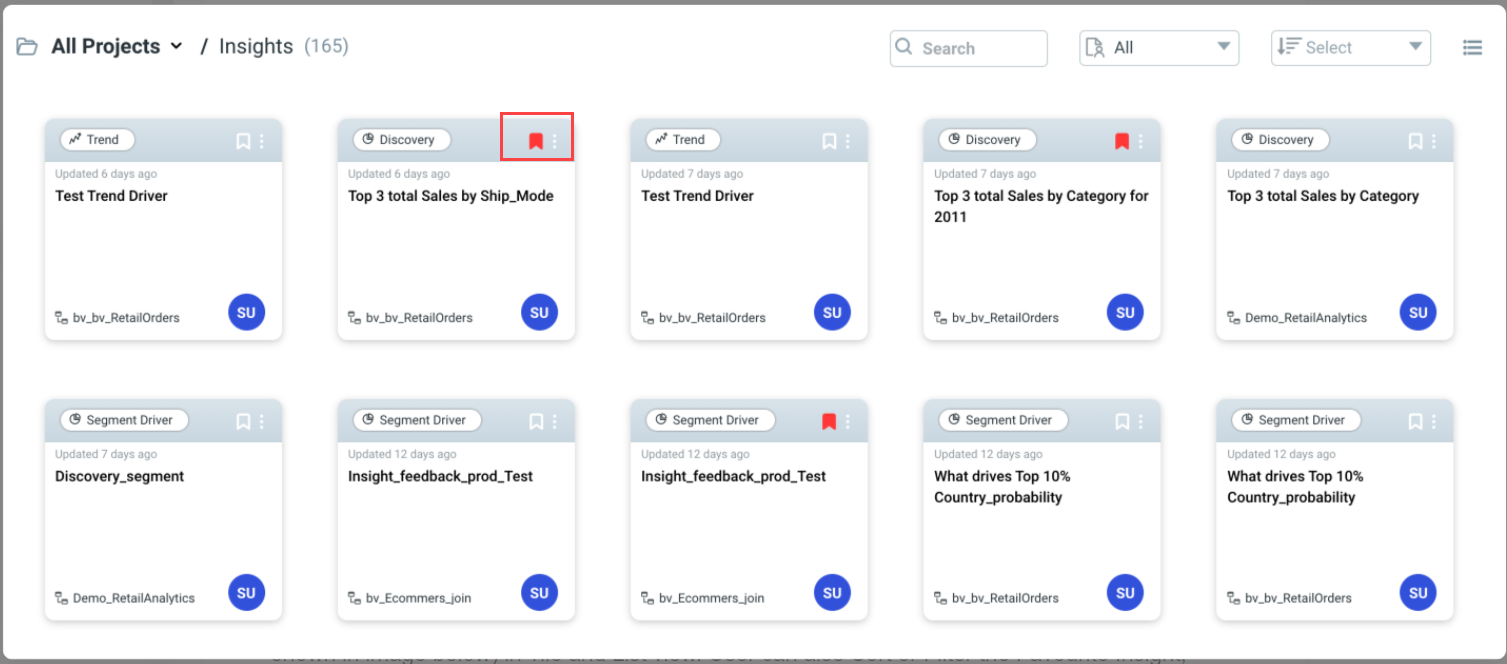
Mark Insights, Vizapads, Model as Favorite
You can tag an Insight, Vizpad, and Model as Favorite by clicking on the Favorite tag in Tile and List view.
The tag is highlighted in red when selected.
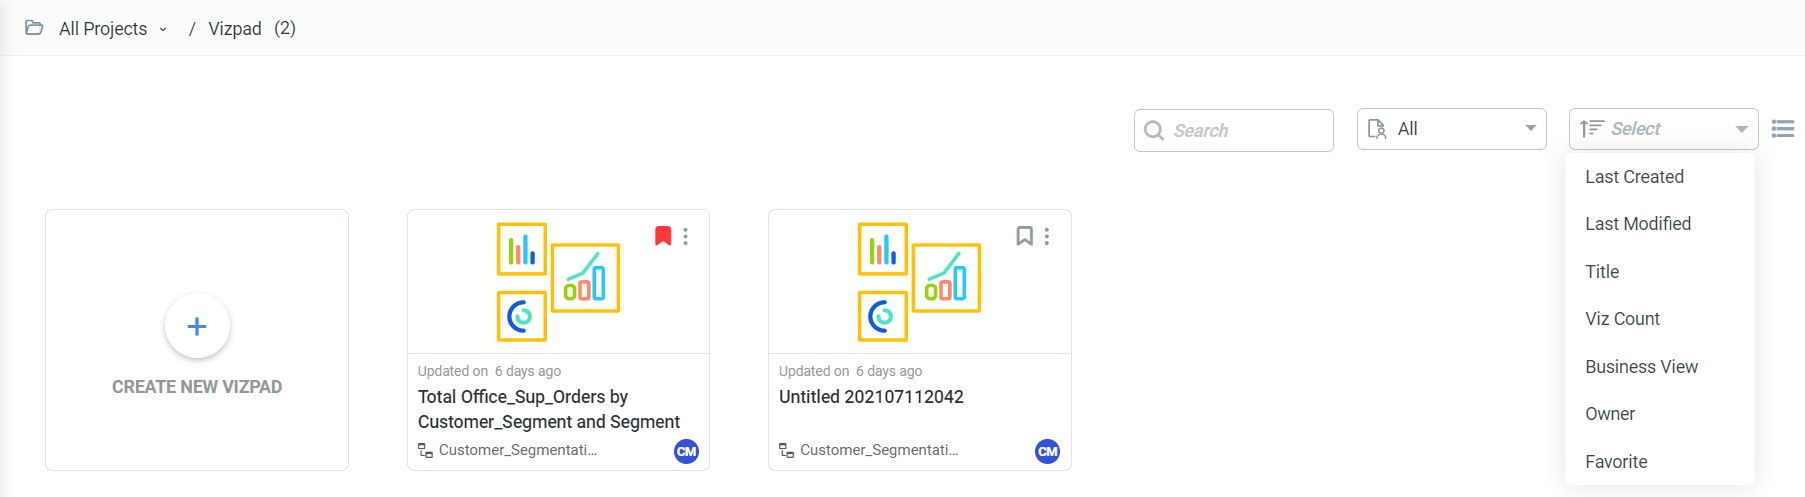
Sort/Filter Favourite Insights, Vizpads, and Models
You can also Sort or Filter the Favorite Insight, Vizpad, and Models. To sort or filter, select the option from the drop-down list.
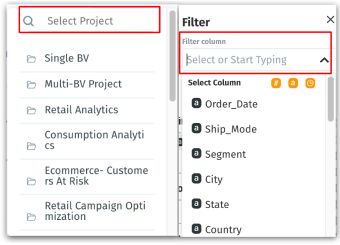
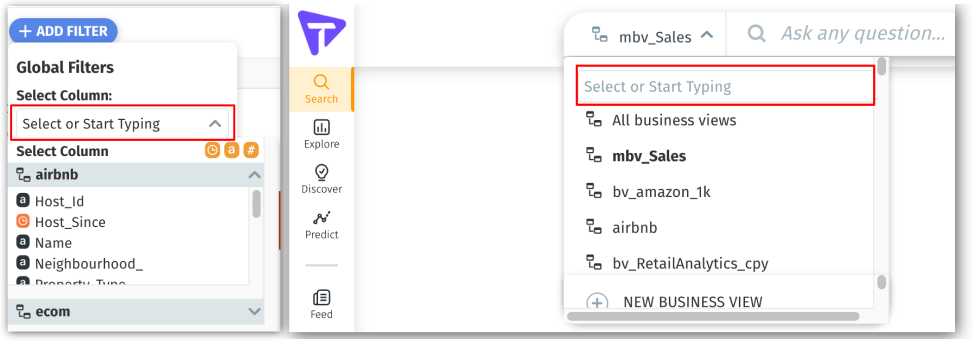
Enhanced filtering experience
In addition to the existing scroll bar in dropdown menus, Tinace has included a search bar in places of dropdown for easier and faster selection of the required component.
If you need to pick an option, a dropdown appears where you can find a search bar with the text Select or Start Typing.
- Click on the search bar and start typing the required content.
- According to the input, the appropriate options will be displayed under the search bar.
- If you’re choosing a column, you can find icons representing Date/time dimensions, Dimensions, and Measures, as shown below.
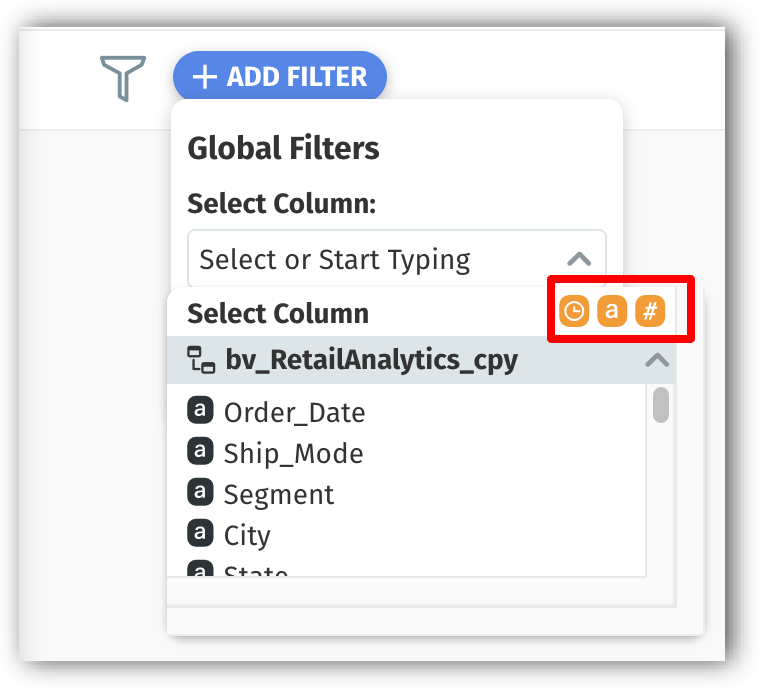
- The icons enable you to display only the required column types. Click on the required icon(s) to select/deselect.
- The search bar has been included in the following places across Tinace:
- Search tab - The list of available Business Views
- Explore tab
- The list of columns under Add filter when you apply global filters for a Vizpad.
- The list of columns under Filter when you apply local filters for a chart.
- The list of columns displayed under Settings → Configuration panel for the selected measure.
- The list of Projects is displayed when you save a newly created Vizpad.
- Discover tab
- During the selection of measures, dimensions, date columns, cohort columns, and cohort values (after selecting the type of Insight).
- The list of Projects is displayed when you save a newly created Insight.
- During the selection of a Business View before creating any Vizpad/Insight/Model/Project.